LSE Investor Presentation Deck
London
Stock Exchange Group
Income by segment - growth in all core segments
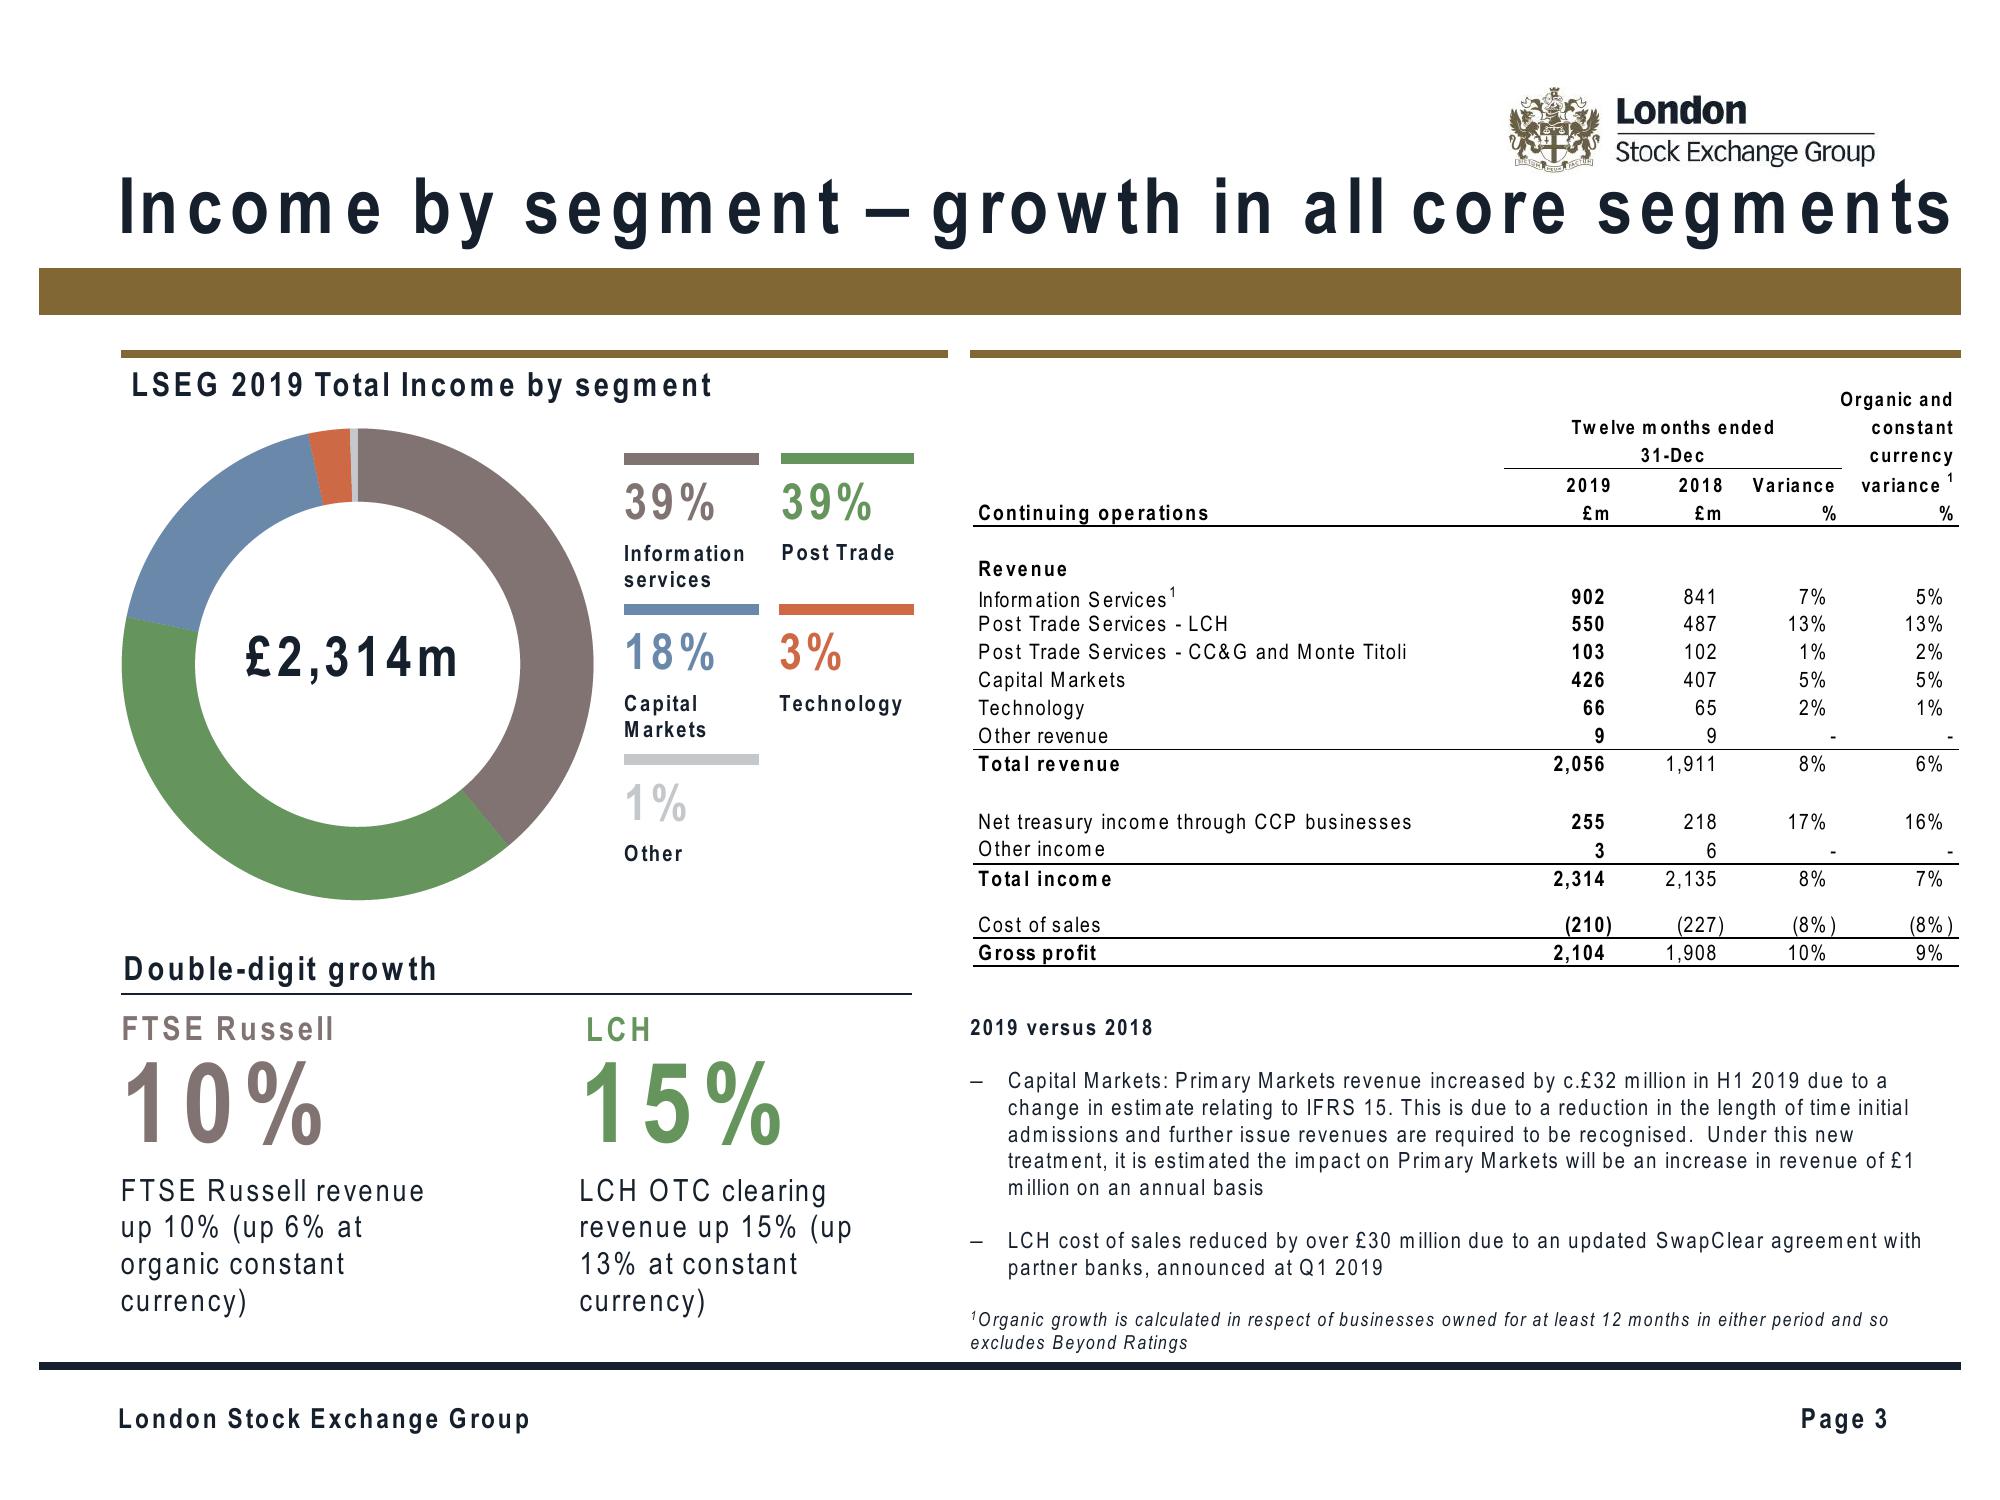
LSEG 2019 Total Income by segment
C
£2,314m
Double-digit growth
FTSE Russell
10%
FTSE Russell revenue
up 10% (up 6% at
organic constant
currency)
London Stock Exchange Group
39%
39%
Information Post Trade
services
18%
Capital
Markets
1%
Other
3%
Technology
LCH
15%
LCH OTC clearing
revenue up 15% (up
13% at constant
currency)
Continuing operations
Revenue
Information Services¹
Post Trade Services LCH
Post Trade Services CC&G and Monte Titoli
Capital Markets
Technology
Other revenue
Total revenue
Net treasury income through CCP businesses
Other income
Total income
Cost of sales
Gross profit
2019 versus 2018
Twelve months ended
31-Dec
2019
£m
902
550
103
426
66
9
2,056
255
3
2,314
(210)
Organic and
constant
currency
2018 Variance variance
£m
2,104
841
487
102
407
65
9
1,911
218
6
2,135
(227)
1,908
%
7%
13%
1%
5%
2%
8%
17%
8%
(8%)
10%
1Organic growth is calculated in respect of businesses owned for at least 12 months in either period and so
excludes Beyond Ratings
5%
13%
2%
5%
1%
Capital Markets: Primary Markets revenue increased by c.£32 million in H1 2019 due to a
change in estimate relating to IFRS 15. This is due to a reduction in the length of time initial
admissions and further issue revenues are required to be recognised. Under this new
treatment, it is estimated the impact on Primary Markets will be an increase in revenue of £1
million on an annual basis
Page 3
%
6%
16%
LCH cost of sales reduced by over £30 million due to an updated SwapClear agreement with
partner banks, announced at Q1 2019
7%
1
(8%)
9%View entire presentation