Repay SPAC
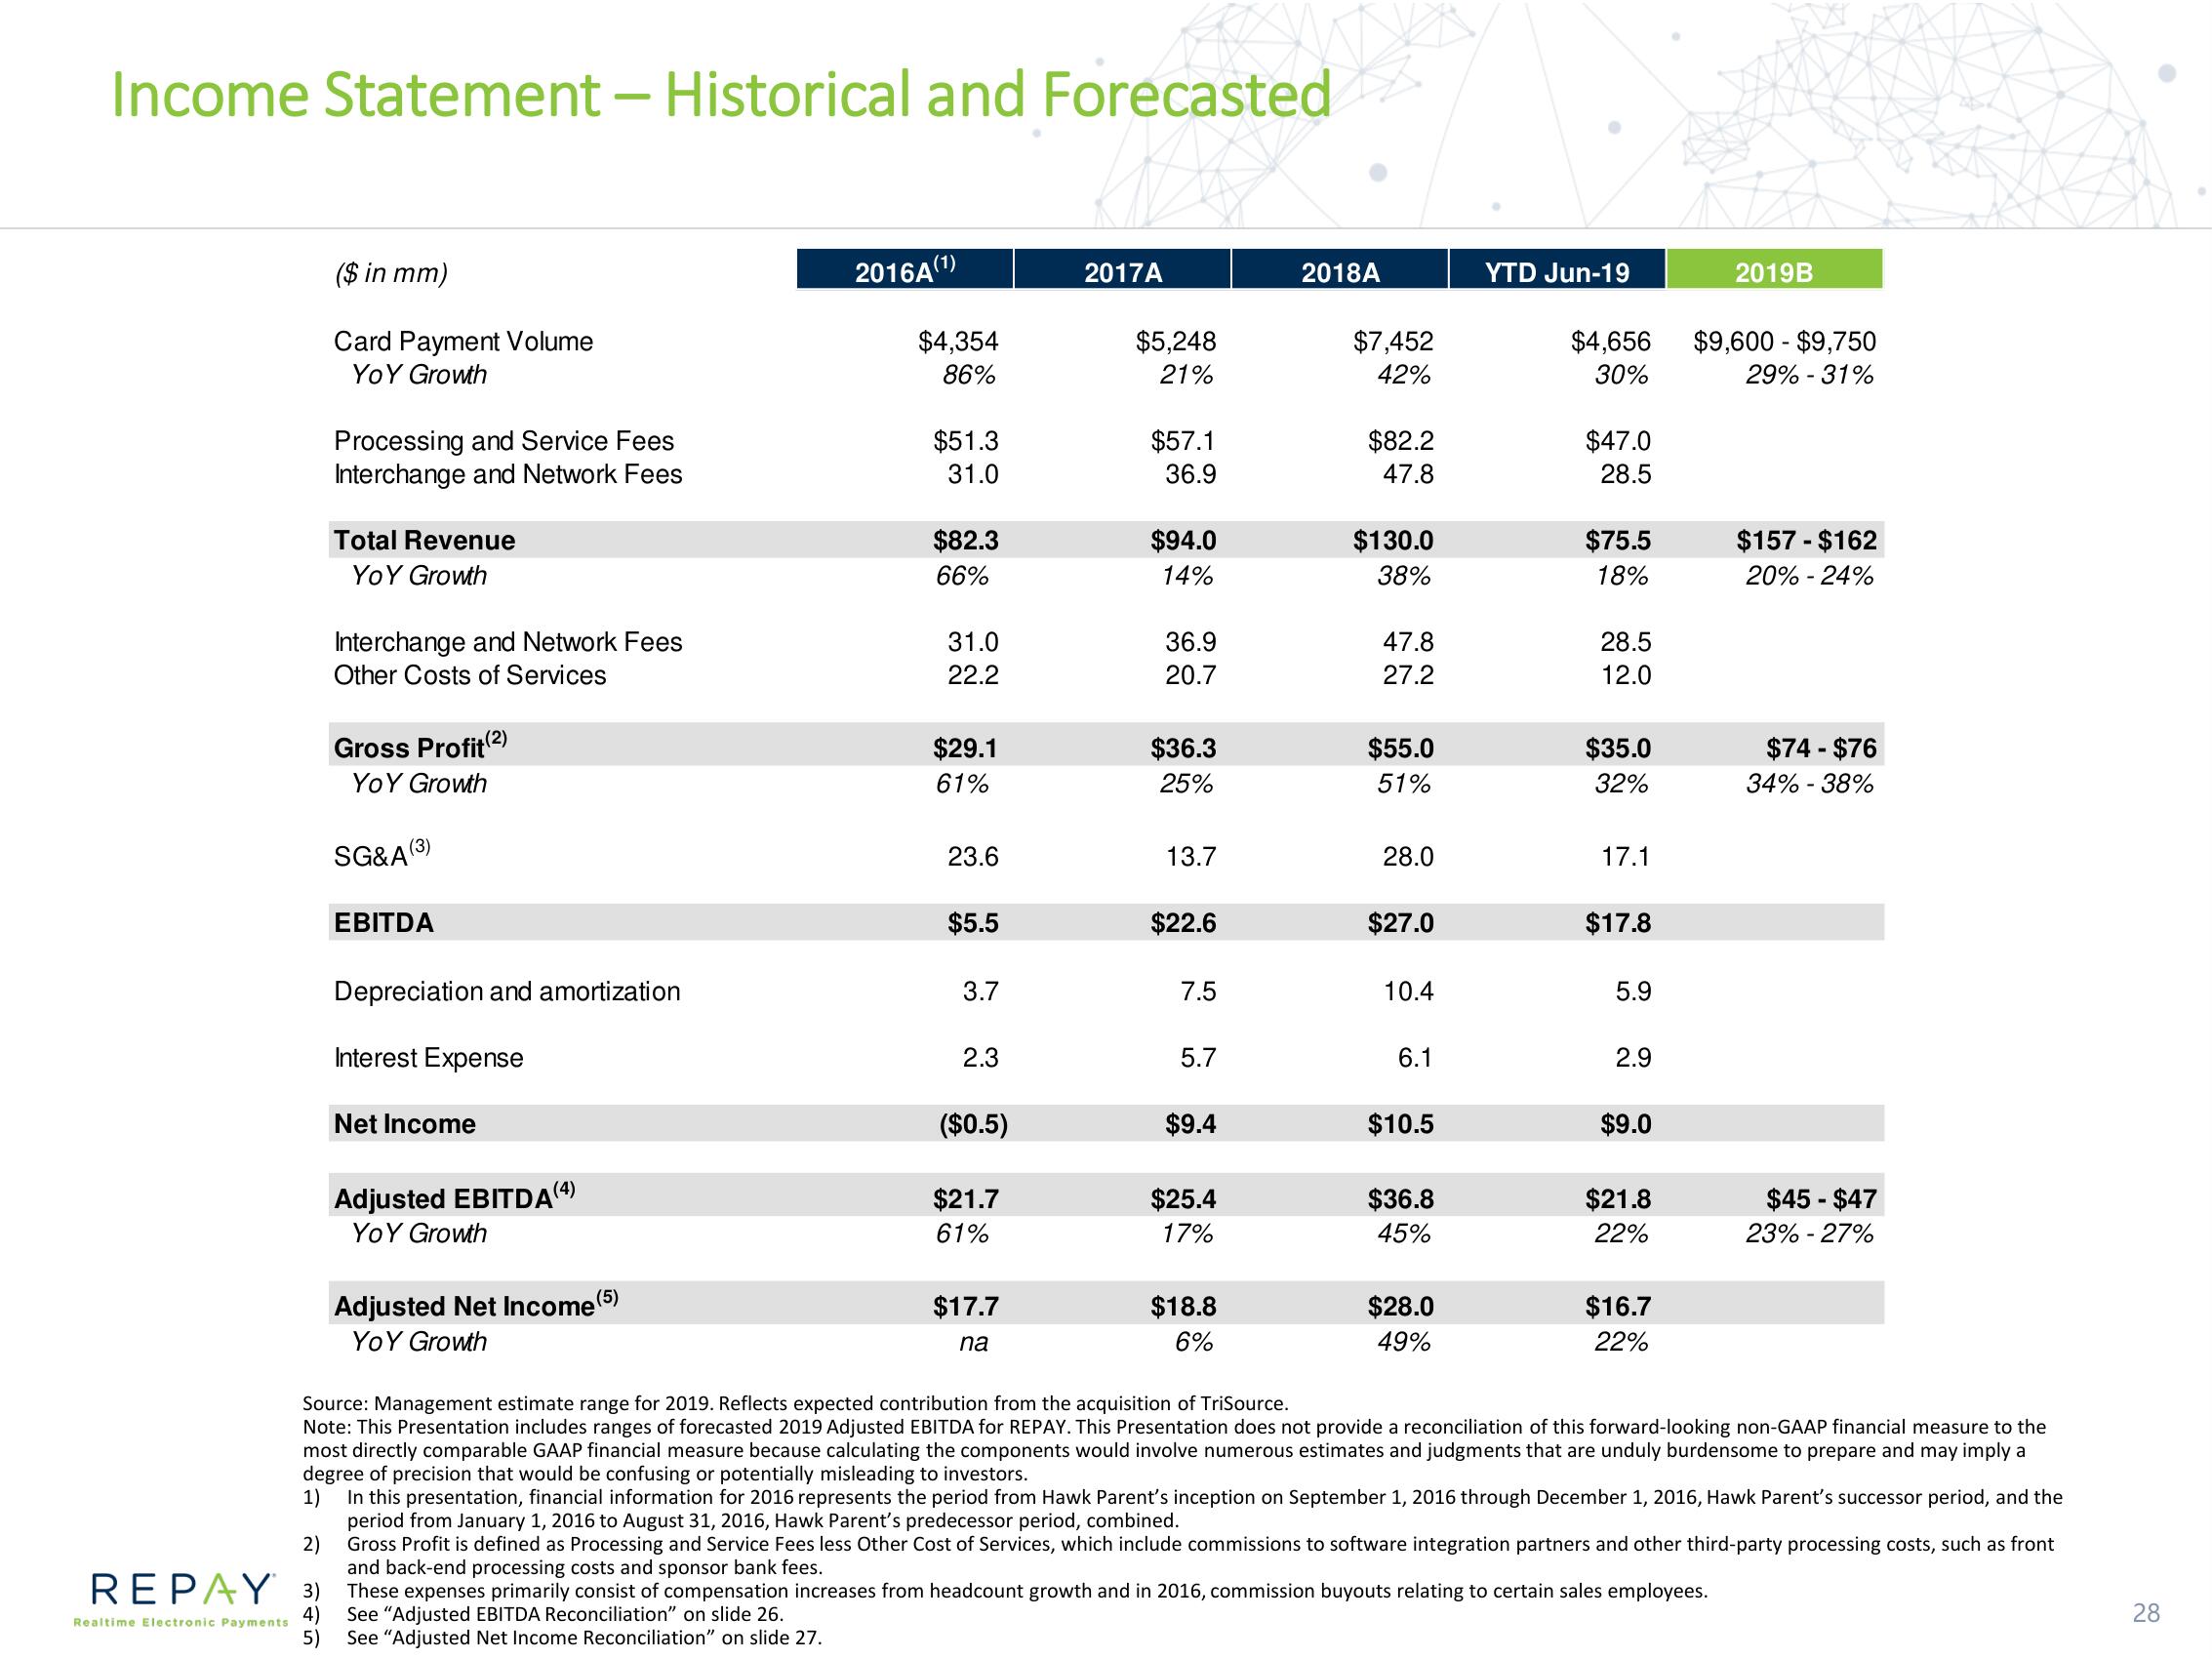
Income Statement - Historical and Forecasted
($ in mm)
Card Payment Volume
YOY Growth
2)
REPAY 3)
4)
Realtime Electronic Payments
5)
Processing and Service Fees
Interchange and Network Fees
Total Revenue
YoY Growth
Interchange and Network Fees
Other Costs of Services
Gross Profit (2)
Yo Y Growth
SG&A (3)
EBITDA
Depreciation and amortization
Interest Expense
Net Income
Adjusted EBITDA(4
Yo Y Growth
Adjusted Net Income (5)
Yo Y Growth
2016A(¹)
$4,354
86%
$51.3
31.0
$82.3
66%
31.0
22.2
$29.1
61%
23.6
$5.5
3.7
2.3
($0.5)
$21.7
61%
$17.7
na
2017A
$5,248
21%
$57.1
36.9
$94.0
14%
36.9
20.7
$36.3
25%
13.7
$22.6
7.5
5.7
$9.4
$25.4
17%
$18.8
6%
2018A
$7,452
42%
$82.2
47.8
$130.0
38%
47.8
27.2
$55.0
51%
28.0
$27.0
10.4
6.1
$10.5
$36.8
45%
$28.0
49%
YTD Jun-19
$4,656
30%
$47.0
28.5
$75.5
18%
28.5
12.0
$35.0
32%
17.1
$17.8
5.9
2.9
$9.0
$21.8
22%
$16.7
22%
2019B
$9,600 $9,750
29% -31%
These expenses primarily consist of compensation increases from headcount growth and in 2016, commission buyouts relating to certain sales employees.
See "Adjusted EBITDA Reconciliation" on slide 26.
See "Adjusted Net Income Reconciliation" on slide 27.
$157 - $162
20% -24%
$74 - $76
34% -38%
Source: Management estimate range for 2019. Reflects expected contribution from the acquisition of TriSource.
Note: This Presentation includes ranges of forecasted 2019 Adjusted EBITDA for REPAY. This Presentation does not provide a reconciliation of this forward-looking non-GAAP financial measure to the
most directly comparable GAAP financial measure because calculating the components would involve numerous estimates and judgments that are unduly burdensome to prepare and may imply a
degree of precision that would be confusing or potentially misleading to investors.
1) In this presentation, financial information for 2016 represents the period from Hawk Parent's inception on September 1, 2016 through December 1, 2016, Hawk Parent's successor period, and the
period from January 1, 2016 to August 31, 2016, Hawk Parent's predecessor period, combined.
Gross Profit is defined as Processing and Service Fees less Other Cost of Services, which include commissions to software integration partners and other third-party processing costs, such as front
and back-end processing costs and sponsor bank fees.
$45 - $47
23% -27%
28View entire presentation