NuStar Energy Investor Conference Presentation Deck
NuStar
Along With Strong Operational Performance Across
Our Footprint
...
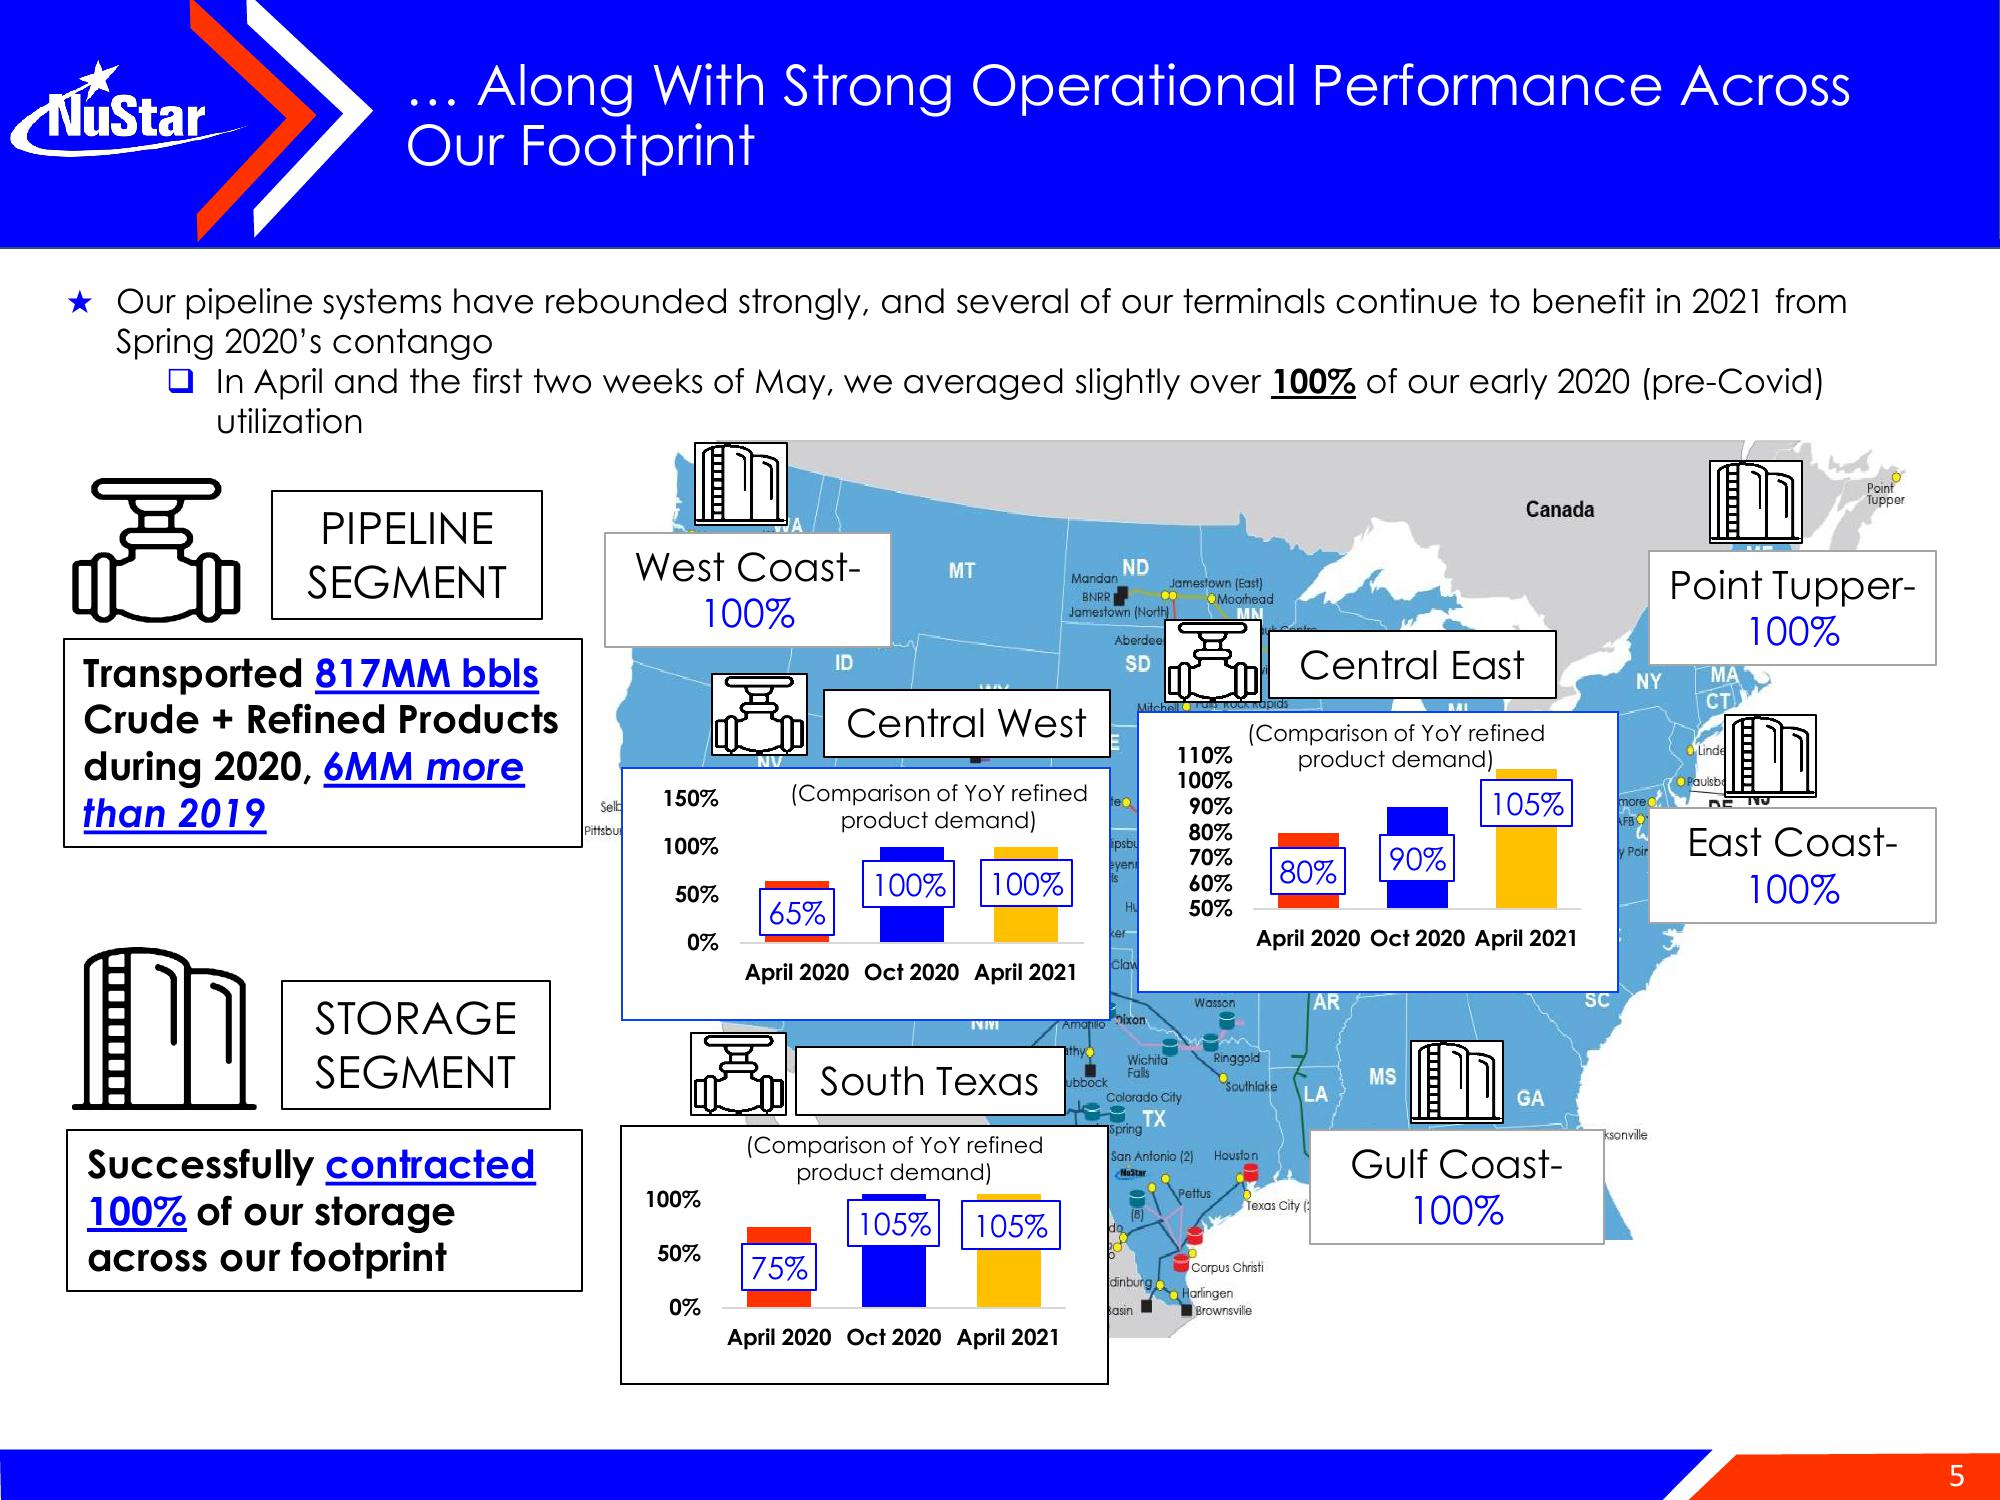
Our pipeline systems have rebounded strongly, and several of our terminals continue to benefit in 2021 from
Spring 2020's contango
In April and the first two weeks of May, we averaged slightly over 100% of our early 2020 (pre-Covid)
utilization
高
Transported 817MM bbls
Crude + Refined Products
during 2020, 6MM more
than 2019
PIPELINE
SEGMENT
n
Successfully contracted
100% of our storage
across our footprint
STORAGE
SEGMENT
Selb
Pittsbu
West Coast-
100%
150%
100%
50%
0%
100%
50%
0%
65%
ID
MT
Central West
(Comparison of YoY refined
product demand)
100% 100%
75%
April 2020 Oct 2020 April 2021
TYIVI
South Texas
(Comparison of YoY refined
product demand)
105% 105%
ND
Mandan
BNRR
Jamestown (North)
Aberdee
SD
April 2020 Oct 2020 April 2021
athy
ipsbu
eyen
Amolo Dixon
ubbock
Hu
Claw
do
Wichita
Falls
Colorado City
TX
Spring
San Antonio (2)
NoStar
(8)
dinburg
Jamestown (East)
Moorhead
MN
Basin
110%
100%
90%
80%
70%
60%
50%
Wasson
Pettus
Central East
(Comparison of YoY refined
product demand),
Ringgold
Southlake
Houston
80%
April 2020 Oct 2020 April 2021
Corpus Christi
Harlingen
Brownsville
Texas City (
AR
LA
90%
Canada
MS
105%
GA
Gulf Coast-
100%
SC
NY
more
Poir
ksonville
Point Tupper-
100%
ΜΑ
CT
Linde
Paulsbe
DE
Point
Tupper
TYTU
East Coast-
100%
5View entire presentation