Ashtead Group Results Presentation Deck
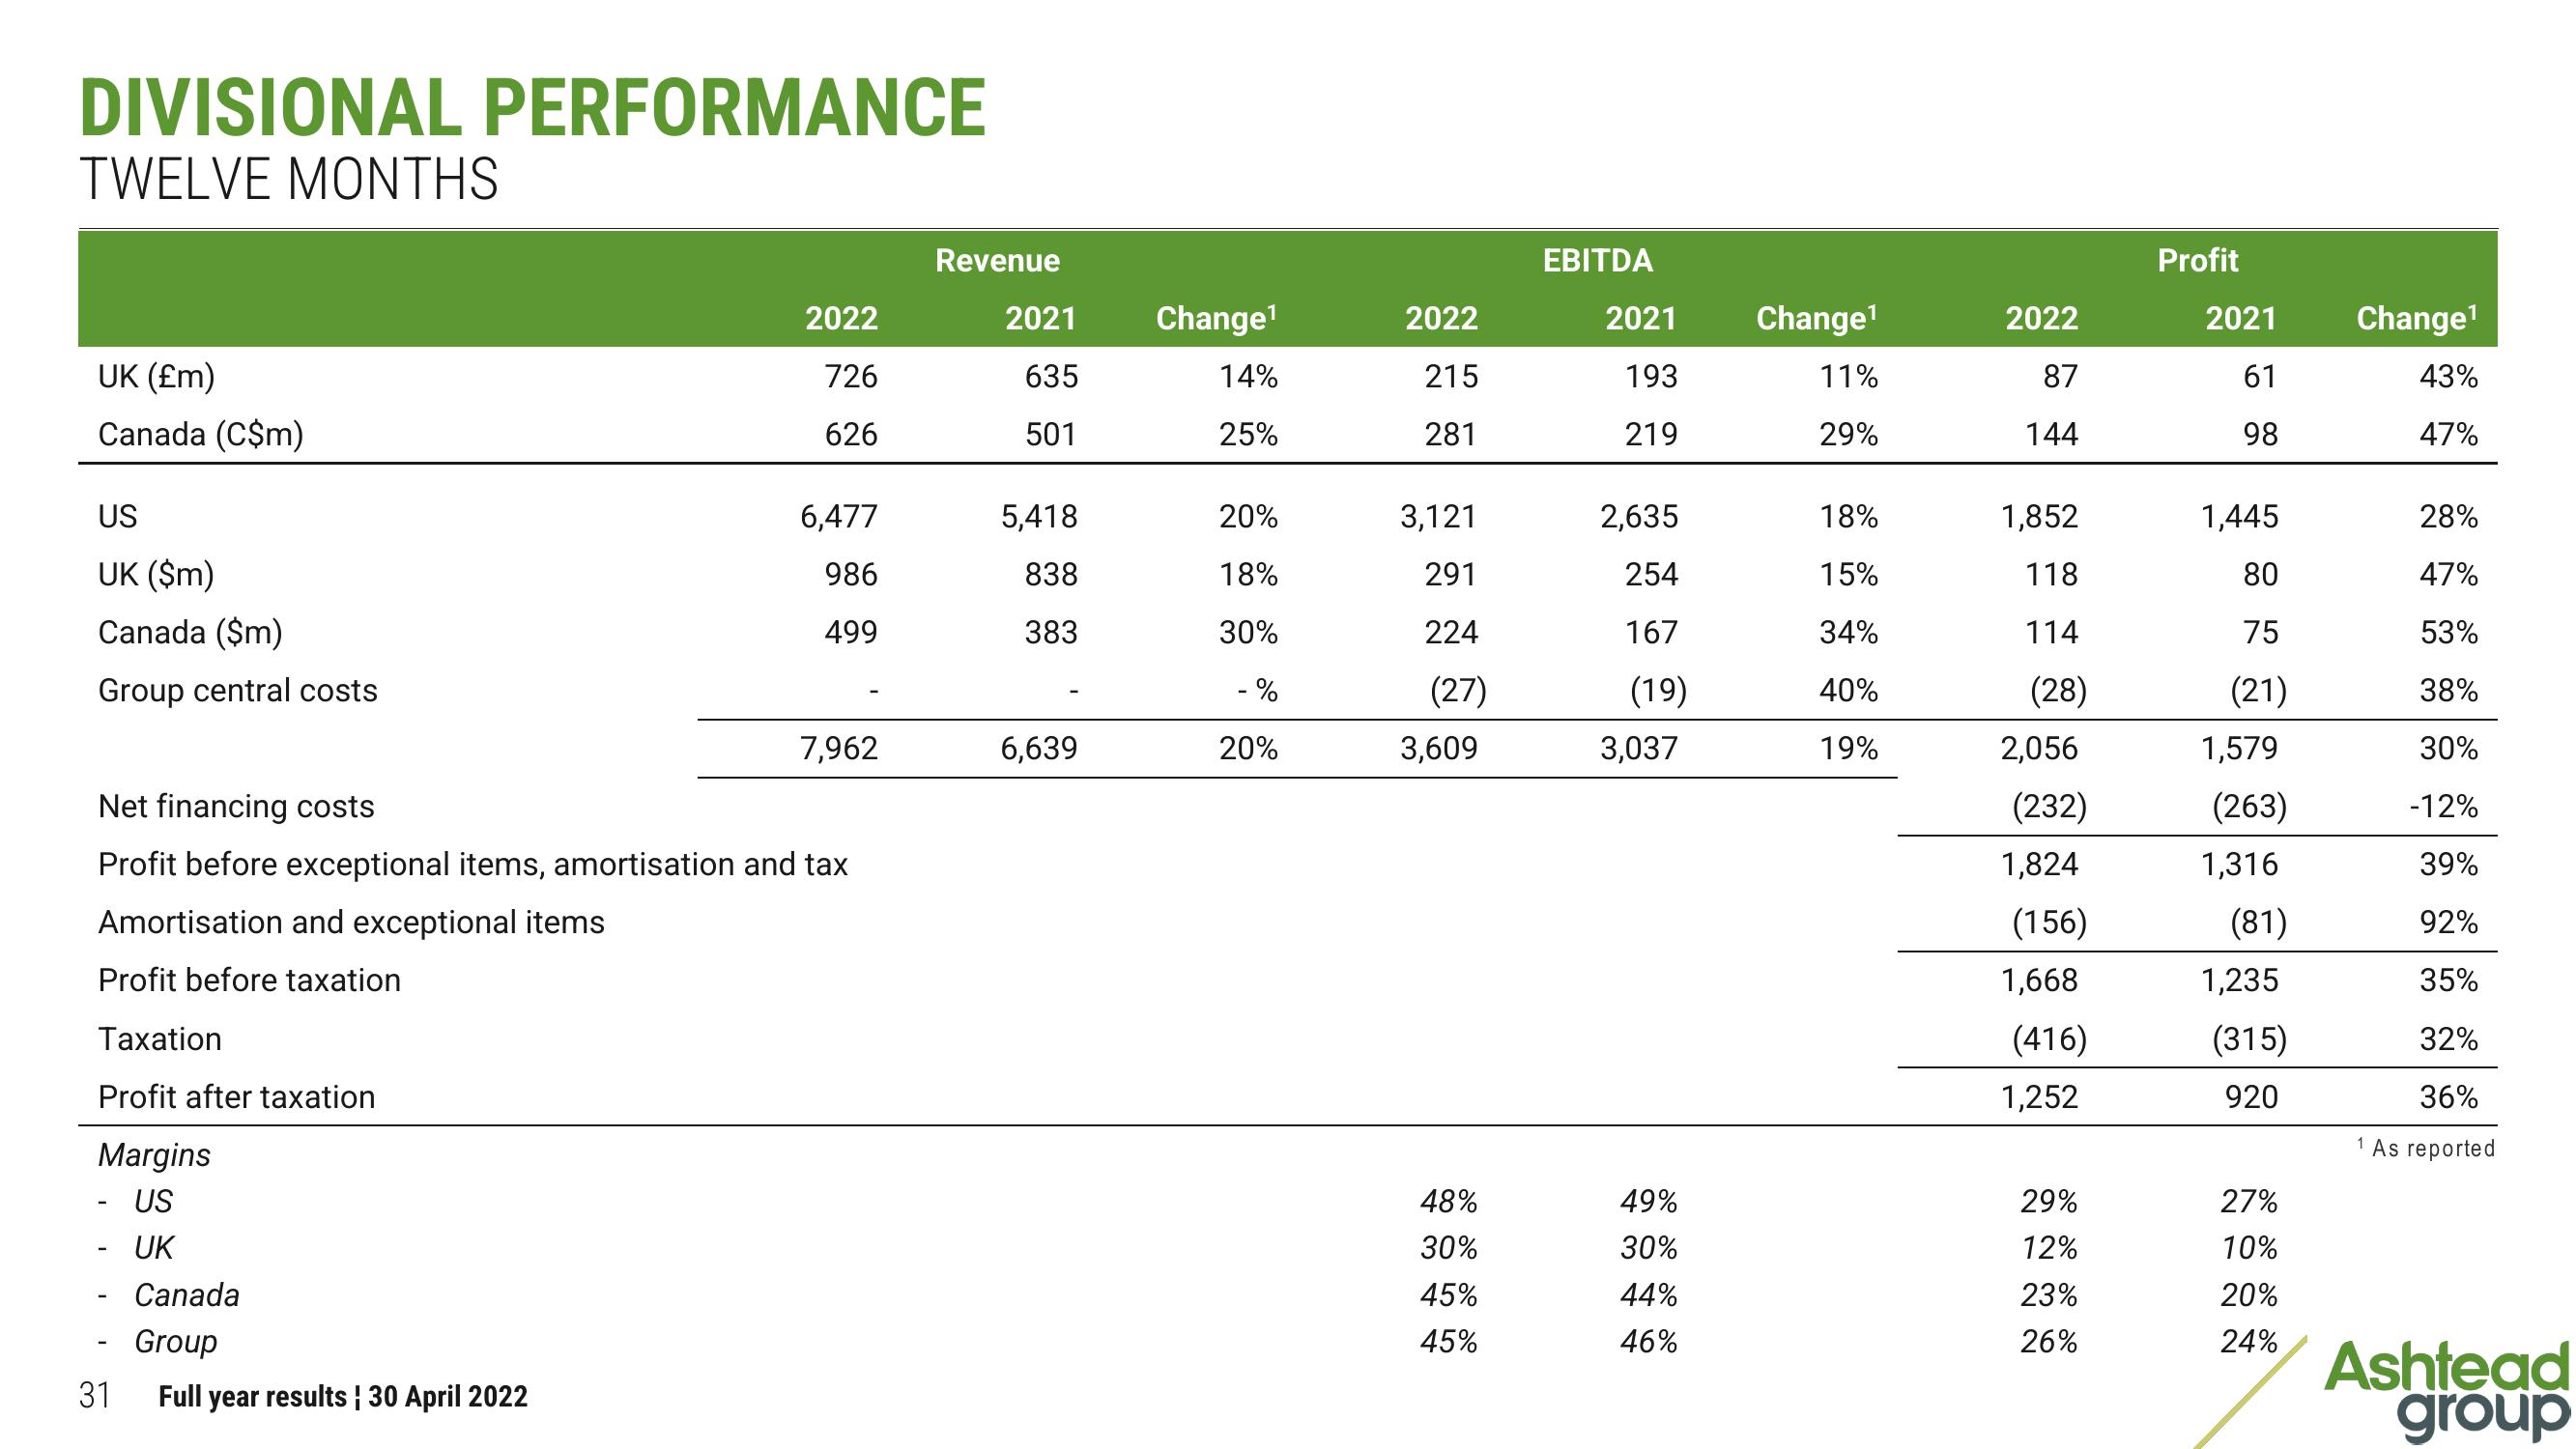
DIVISIONAL PERFORMANCE
TWELVE MONTHS
UK (£m)
Canada (C$m)
US
UK ($m)
Canada ($m)
Group central costs
Amortisation and exceptional items
Profit before taxation
Taxation
Profit after taxation
Margins
- US
UK
31
2022
726
626
Net financing costs
Profit before exceptional items, amortisation and tax
Canada
Group
Full year results | 30 April 2022
6,477
986
499
7,962
Revenue
2021
635
501
5,418
838
383
6,639
Change¹
14%
25%
20%
18%
30%
- %
20%
2022
215
281
3,121
291
224
(27)
3,609
48%
30%
45%
45%
EBITDA
2021
193
219
2,635
254
167
(19)
3,037
49%
30%
44%
46%
Change¹
11%
29%
18%
15%
34%
40%
19%
2022
87
144
1,852
118
114
(28)
2,056
(232)
1,824
(156)
1,668
(416)
1,252
29%
12%
23%
26%
Profit
2021
61
98
1,445
80
75
(21)
1,579
(263)
1,316
(81)
1,235
(315)
920
27%
10%
20%
24%
Change¹
43%
47%
1
28%
47%
53%
38%
30%
-12%
39%
92%
35%
32%
36%
As reported
Ashtead
groupView entire presentation