Shift SPAC Presentation Deck
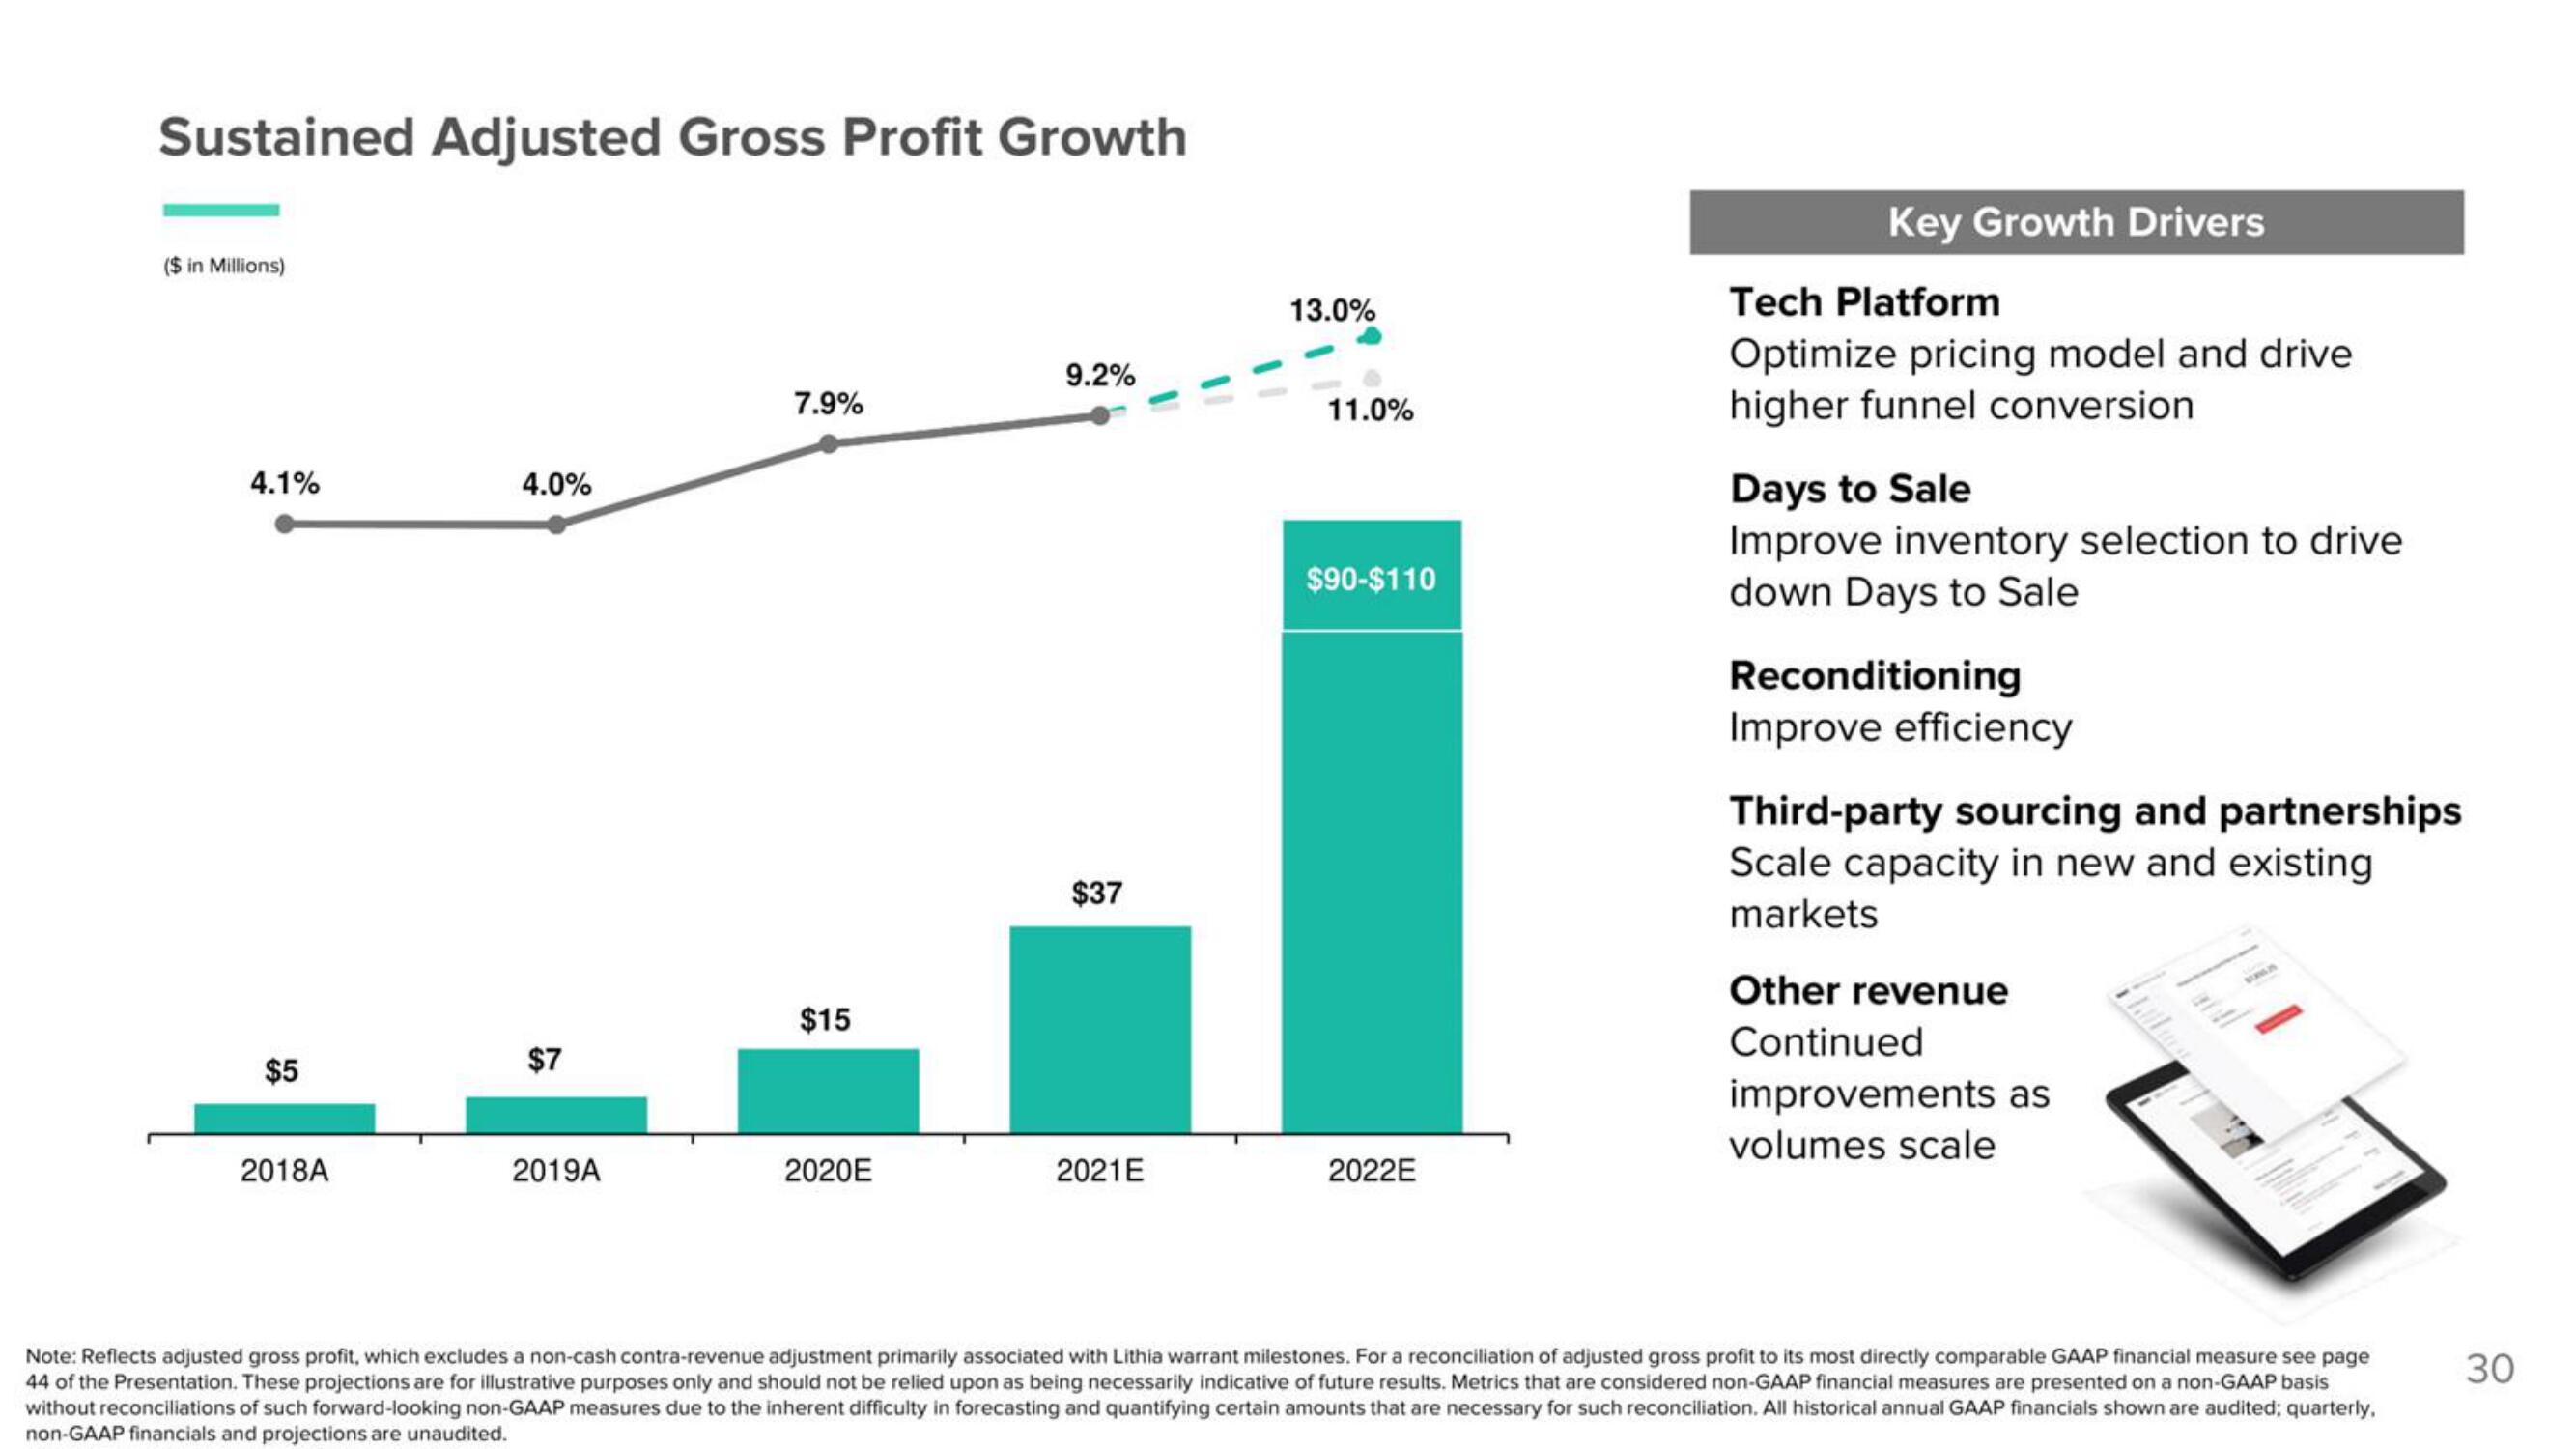
Sustained Adjusted Gross Profit Growth
($ in Millions)
4.1%
$5
2018A
4.0%
$7
2019A
7.9%
$15
2020E
9.2%
$37
2021E
13.0%
11.0%
$90-$110
2022E
Key Growth Drivers
Tech Platform
Optimize pricing model and drive
higher funnel conversion
Days to Sale
Improve inventory selection to drive
down Days to Sale
Reconditioning
Improve efficiency
Third-party sourcing and partnerships
Scale capacity in new and existing
markets
Other revenue
Continued
improvements as
volumes scale
Note: Reflects adjusted gross profit, which excludes a non-cash contra-revenue adjustment primarily associated with Lithia warrant milestones. For a reconciliation of adjusted gross profit to its most directly comparable GAAP financial measure see page
44 of the Presentation. These projections are for illustrative purposes only and should not be relied upon as being necessarily indicative of future results. Metrics that are considered non-GAAP financial measures are presented on a non-GAAP basis
without reconciliations of such forward-looking non-GAAP measures due to the inherent difficulty in forecasting and quantifying certain amounts that are necessary for such reconciliation. All historical annual GAAP financials shown are audited; quarterly,
non-GAAP financials and projections are unaudited.
30View entire presentation