Baird 2018 Annual Global Industrial Conference
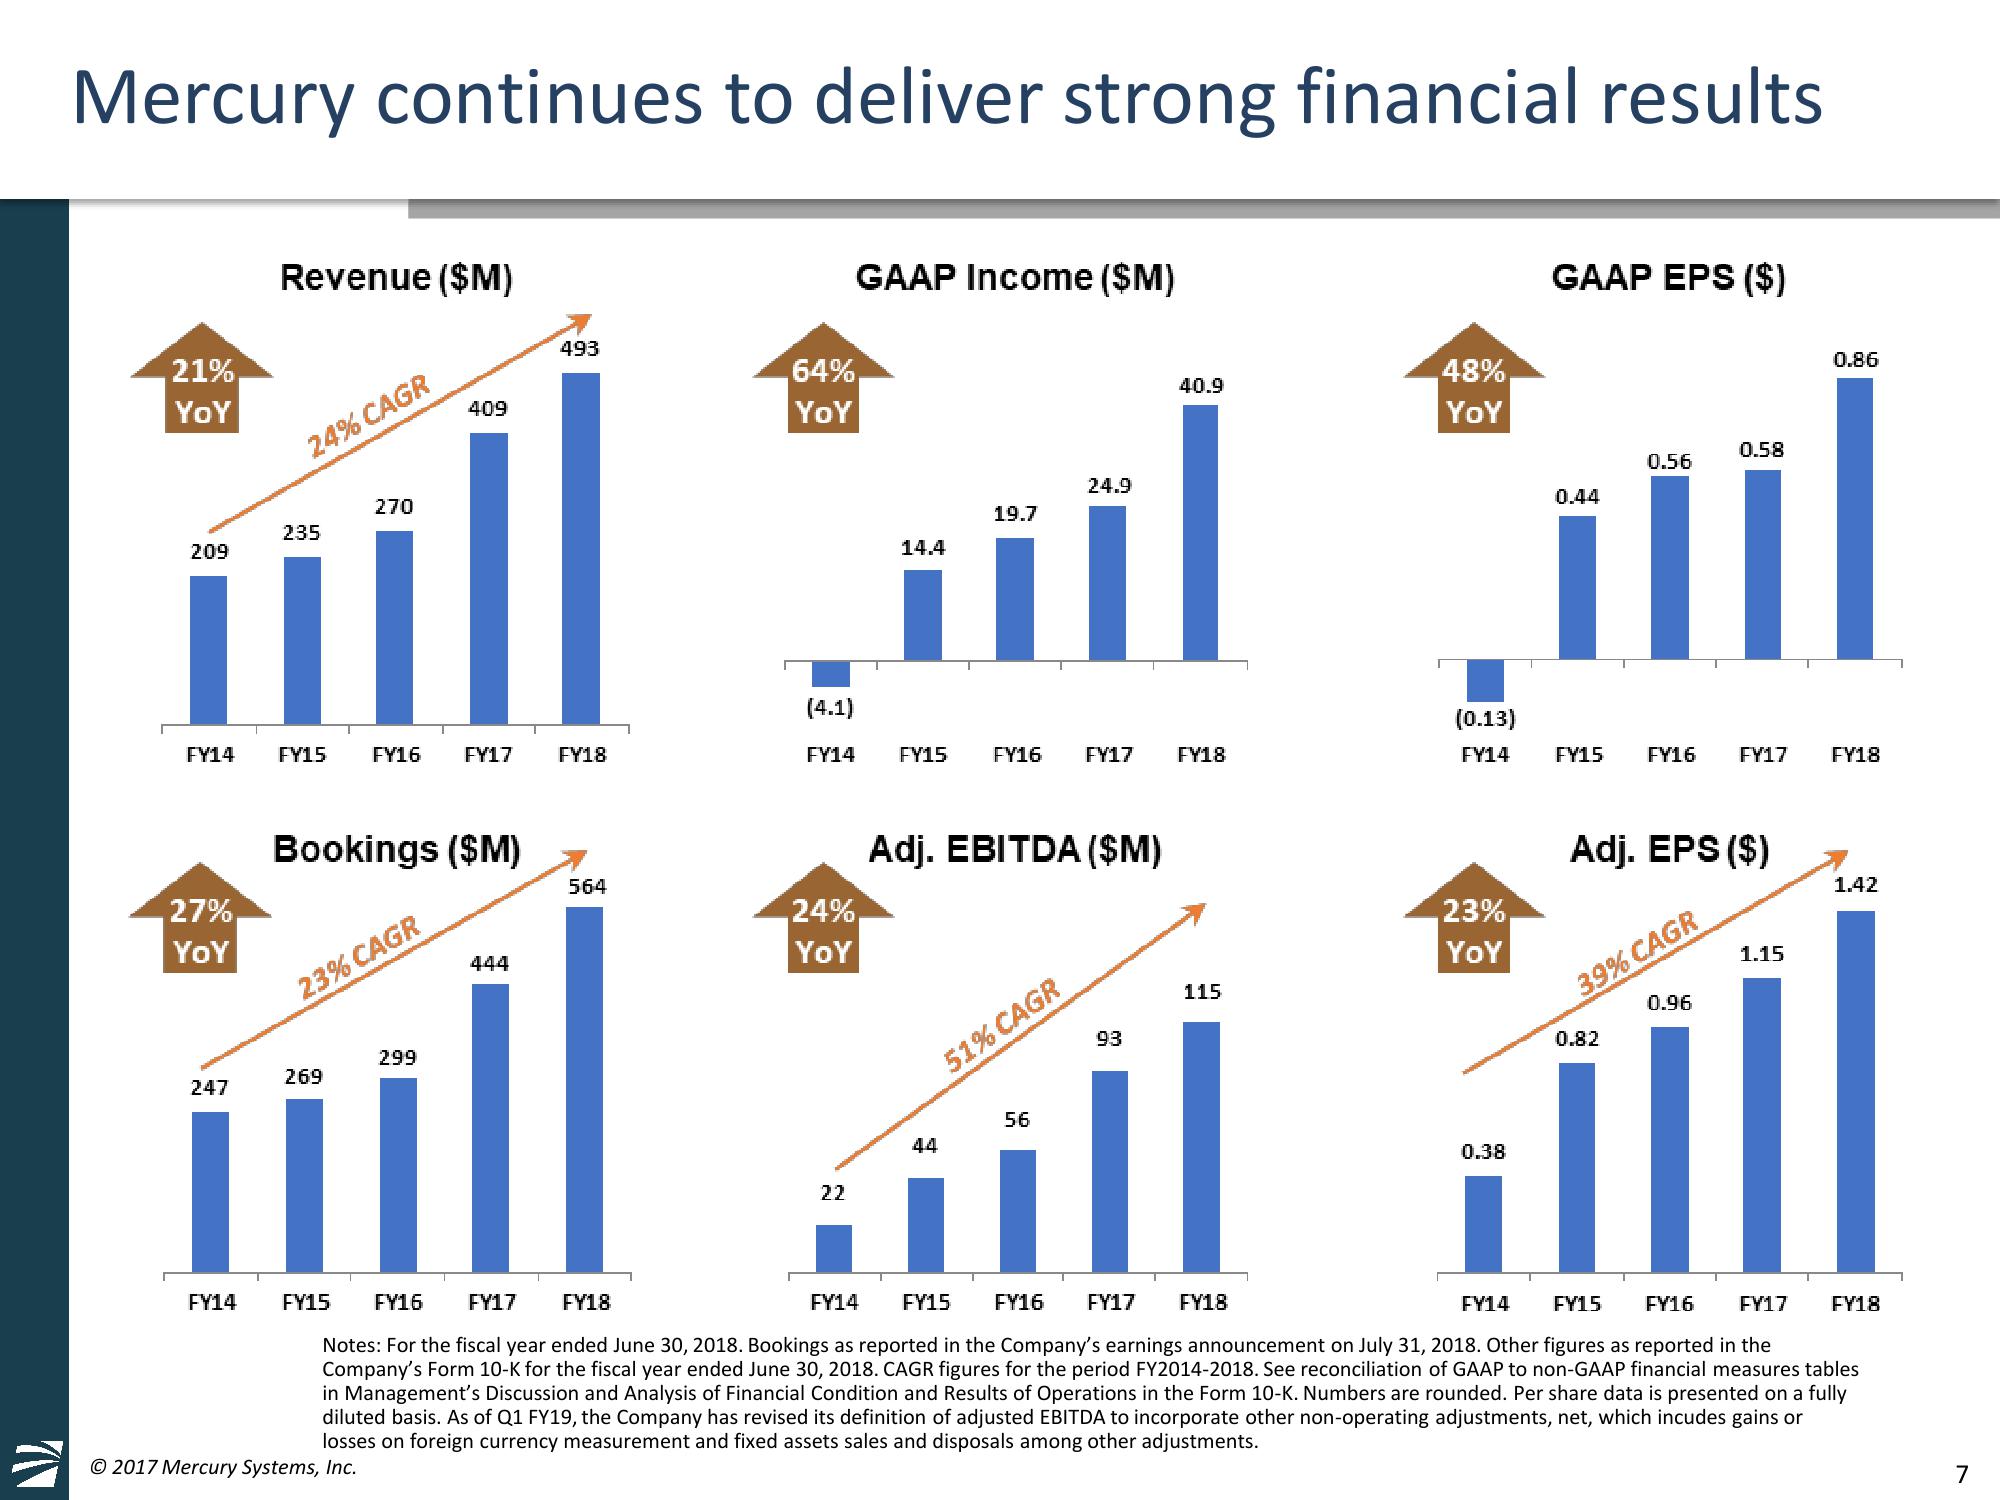
Mercury continues to deliver strong financial results
,21%,
YoY
209
FY14
27%
YoY
247
FY14
Revenue ($M)
24% CAGR
235
FY15
T
269
270
Bookings ($M)
23% CAGR
FY15
FY16 FY17
© 2017 Mercury Systems, Inc.
409
299
444
493
FY18
564
.64%.
YOY
GAAP Income ($M)
.24%
YoY
(4.1)
FY14 FY15
22
14.4
19.7
44
FY16 FY17
Adj. EBITDA ($M)
24.9
51% CAGR
56
93
40.9
FY18
115
.48%
YOY
(0.13)
FY14
23%
YoY
0.38
GAAP EPS ($)
FY14
0.44
0.56
FY15 FY16 FY17
Adj. EPS ($)
39% CAGR
0.82
0.58
0.96
1.15
0.86
FY16 FY17 FY18
FY14 FY15 FY16 FY17 FY18
FY15 FY16
FY17
Notes: For the fiscal year ended June 30, 2018. Bookings as reported in the Company's earnings announcement on July 31, 2018. Other figures as reported in the
Company's Form 10-K for the fiscal year ended June 30, 2018. CAGR figures for the period FY2014-2018. See reconciliation of GAAP to non-GAAP financial measures tables
in Management's Discussion and Analysis of Financial Condition and Results of Operations in the Form 10-K. Numbers are rounded. Per share data is presented on a fully
diluted basis. As of Q1 FY19, the Company has revised its definition of adjusted EBITDA to incorporate other non-operating adjustments, net, which incudes gains or
losses on foreign currency measurement and fixed assets sales and disposals among other adjustments.
FY18
1.42
FY18
7View entire presentation