Bird Results Presentation Deck
Financial Highlights - Q1'23
Revenue
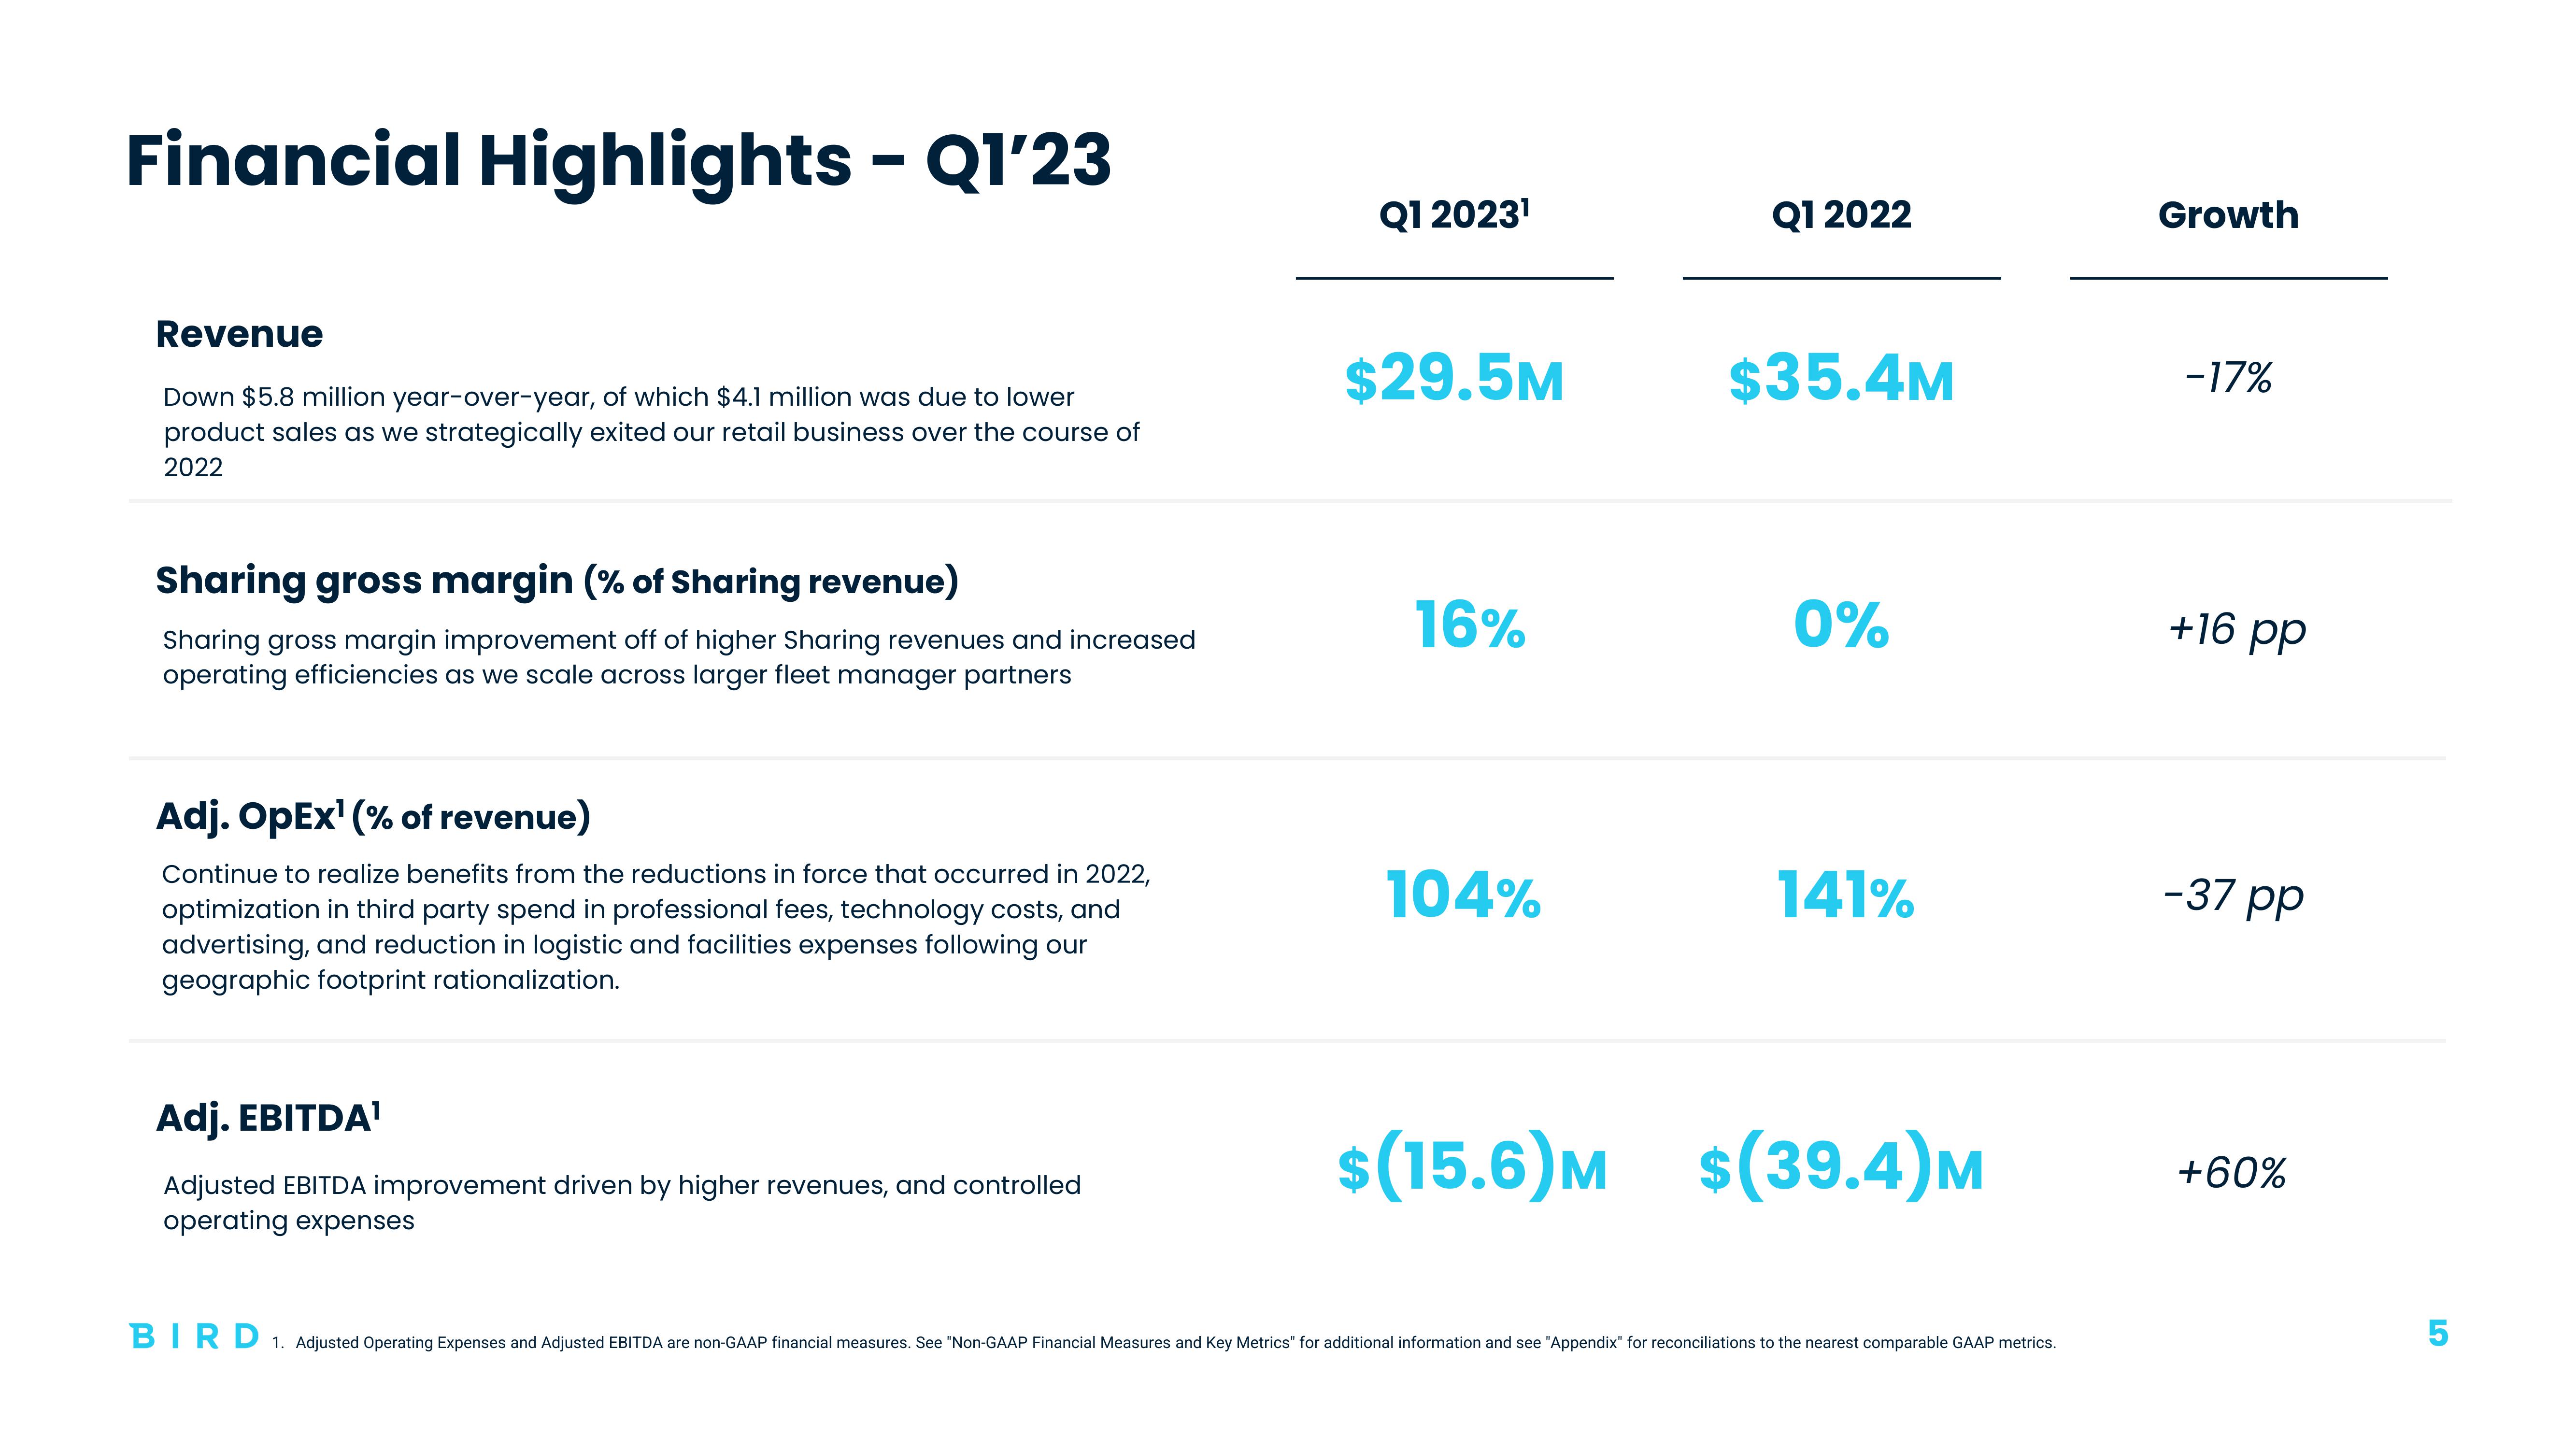
Down $5.8 million year-over-year, of which $4.1 million was due to lower
product sales as we strategically exited our retail business over the course of
2022
Sharing gross margin (% of Sharing revenue)
Sharing gross margin improvement off of higher Sharing revenues and increased
operating efficiencies as we scale across larger fleet manager partners
Adj. OpEx¹ (% of revenue)
Continue to realize benefits from the reductions in force that occurred in 2022,
optimization in third party spend in professional fees, technology costs, and
advertising, and reduction in logistic and facilities expenses following our
geographic footprint rationalization.
Adj. EBITDA¹
Adjusted EBITDA improvement driven by higher revenues, and controlled
operating expenses
Q1 2023¹
$29.5M
16%
104%
Q1 2022
$35.4M
0%
141%
$(15.6)M $(39.4)M
BIRD 1. Adjusted Operating Expenses and Adjusted EBITDA are non-GAAP financial measures. See "Non-GAAP Financial Measures and Key Metrics" for additional information and see "Appendix" for reconciliations to the nearest comparable GAAP metrics.
Growth
-17%
+16 pp
-37 pp
+60%
19
5View entire presentation