First Busey Results Presentation Deck
1.
4Q23 Earnings Investor Presentation
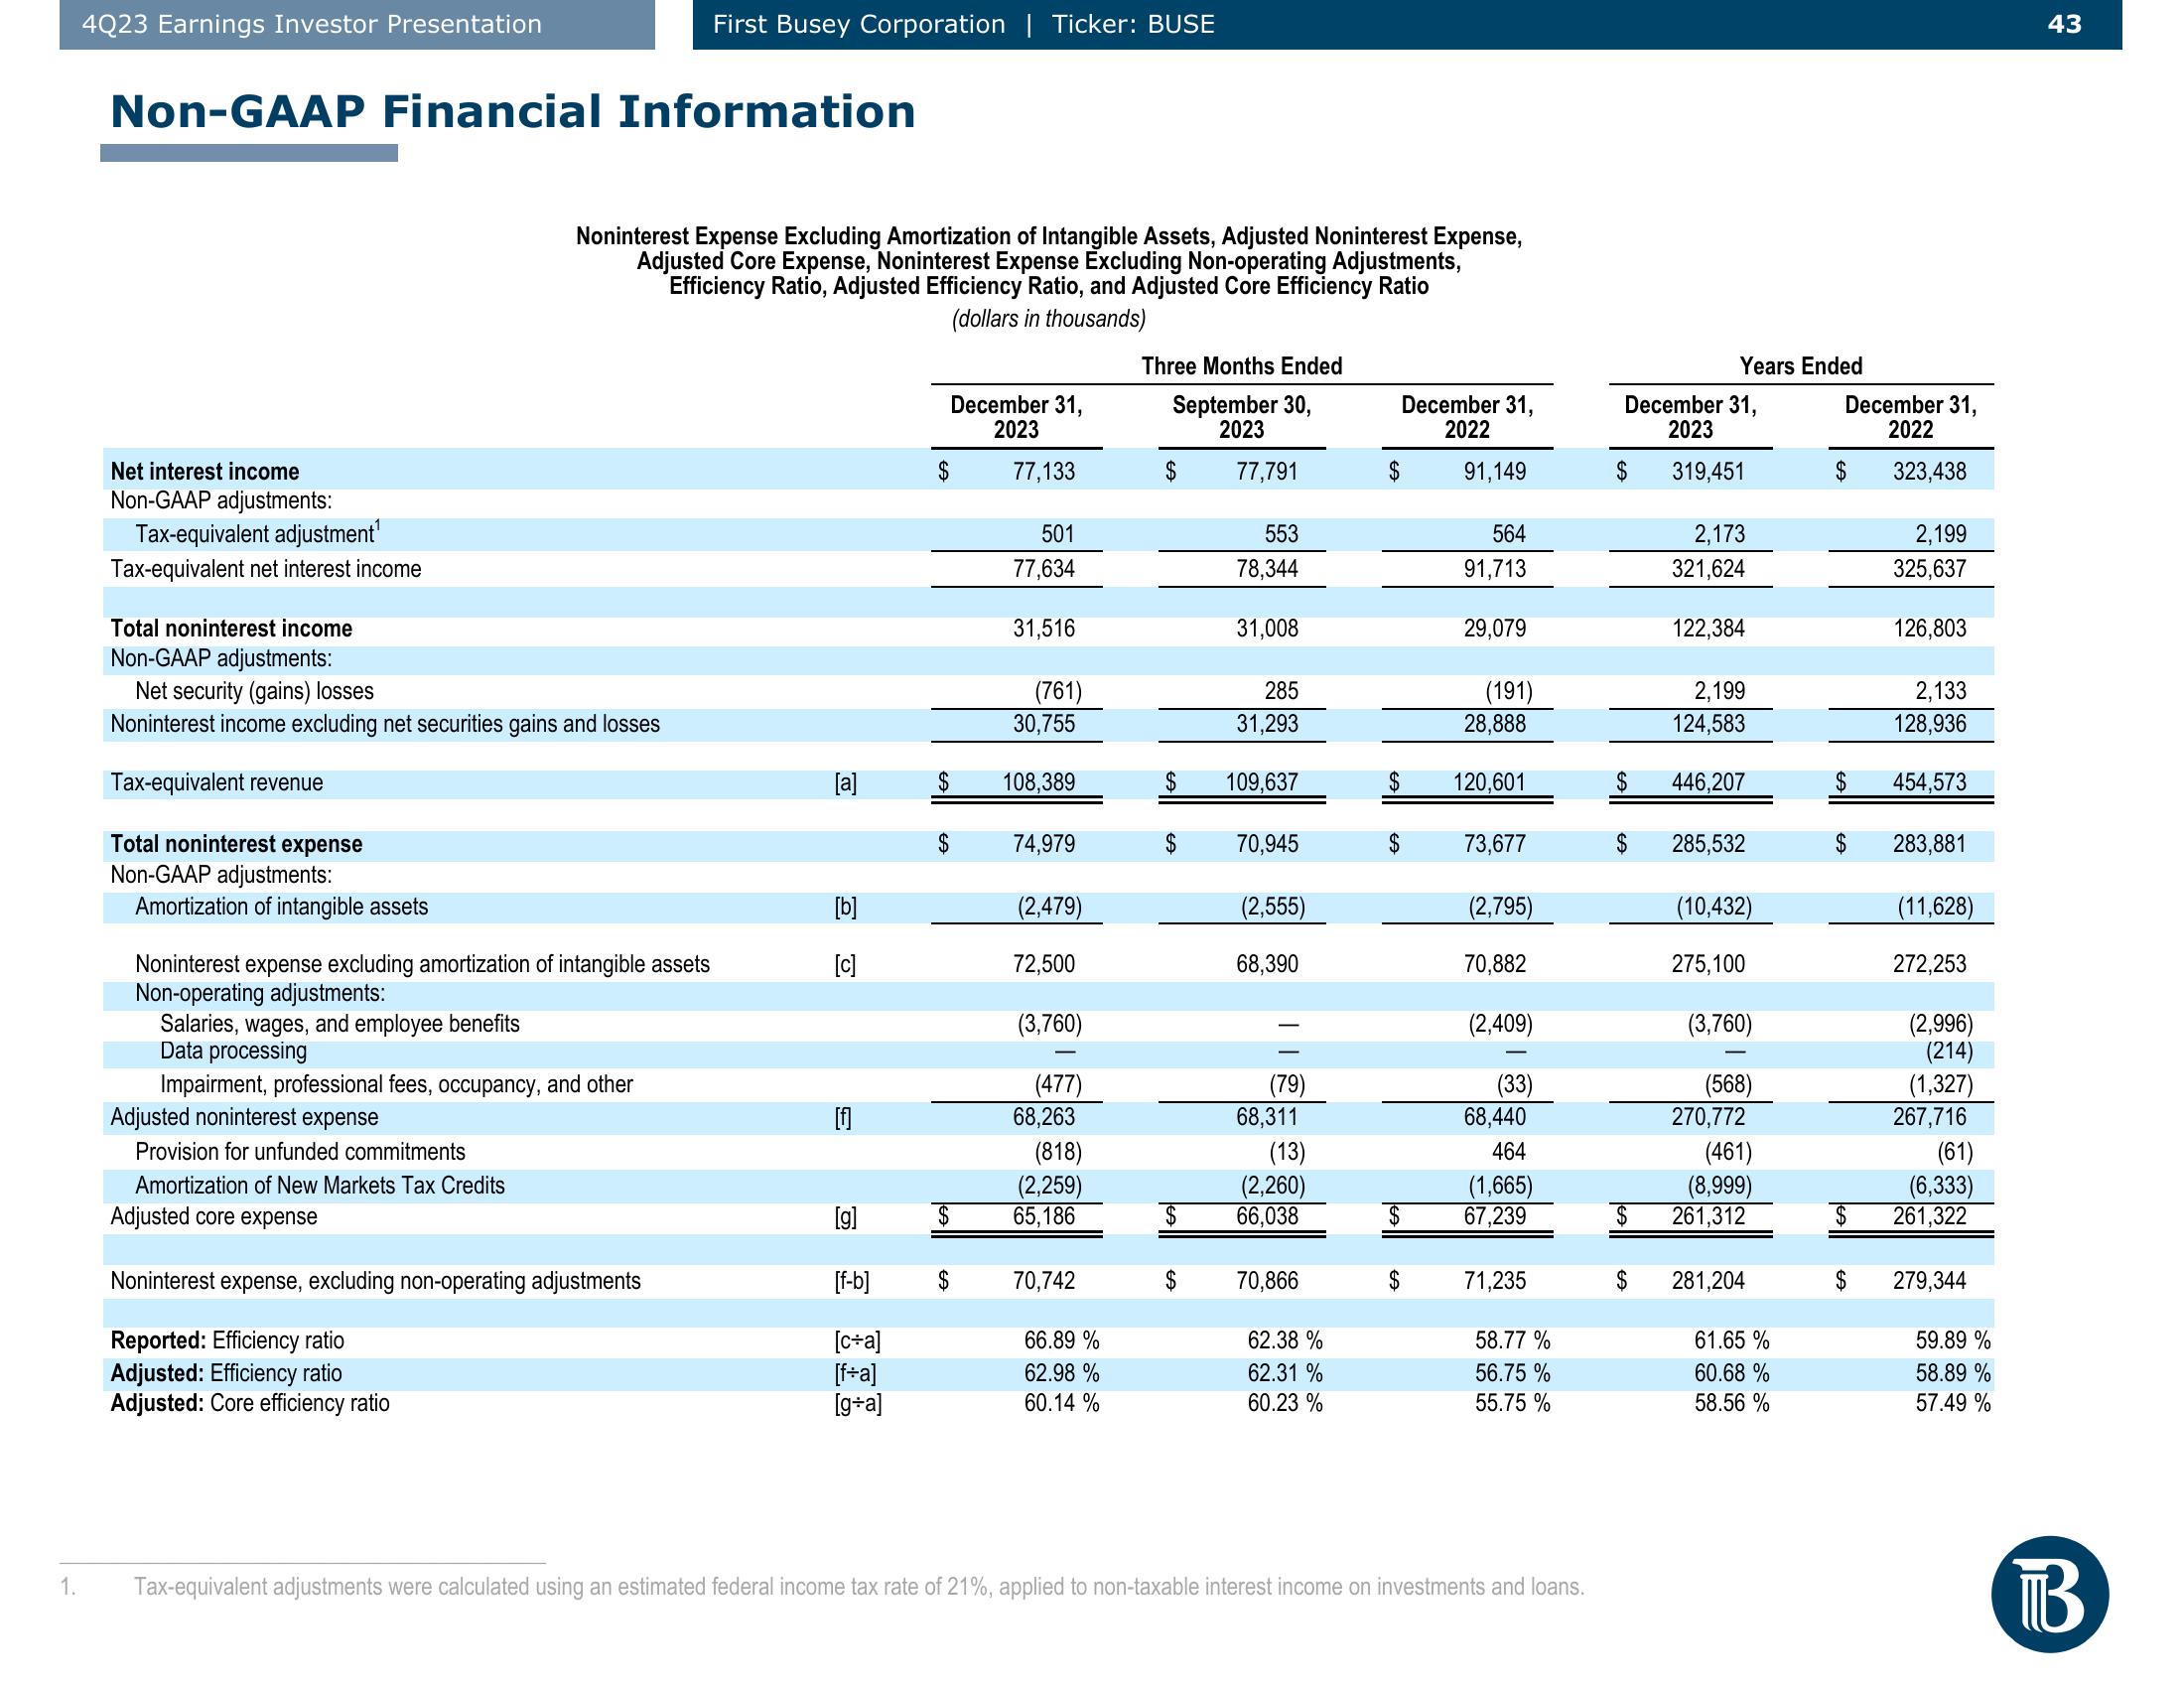
Non-GAAP Financial Information
Net interest income
Non-GAAP adjustments:
Tax-equivalent adjustment¹
Tax-equivalent net interest income
Total noninterest income
Non-GAAP adjustments:
Net security (gains) losses
Noninterest income excluding net securities gains and losses
Tax-equivalent revenue
Total noninterest expense
Non-GAAP adjustments:
Amortization of intangible assets
Noninterest Expense Excluding Amortization of Intangible Assets, Adjusted Noninterest Expense,
Adjusted Core Expense, Noninterest Expense Excluding Non-operating Adjustments,
Efficiency Ratio, Adjusted Efficiency Ratio, and Adjusted Core Efficiency Ratio
(dollars in thousands)
Noninterest expense excluding amortization of intangible assets
Non-operating adjustments:
Salaries, wages, and employee benefits
Data processing
Impairment, professional fees, occupancy, and other
Adjusted noninterest expense
Provision for unfunded commitments
Amortization of New Markets Tax Credits
Adjusted core expense
First Busey Corporation | Ticker: BUSE
Noninterest expense, excluding non-operating adjustments
Reported: Efficiency ratio
Adjusted: Efficiency ratio
Adjusted: Core efficiency ratio
[b]
[c]
[f]
[f-b]
[c+a]
[f+a]
[g+a]
$
$
$
$
December 31,
2023
77,133
$
501
77,634
31,516
(761)
30,755
108,389
74,979
(2,479)
72,500
(3,760)
(477)
68,263
(818)
(2,259)
65,186
70,742
66.89 %
62.98 %
60.14 %
Three Months Ended
September 30,
2023
77,791
$
$
$
$
553
78,344
31,008
285
31,293
109,637
70,945
(2,555)
68,390
(79)
68,311
(13)
(2,260)
66,038
70,866
62.38 %
62.31%
60.23%
December 31,
2022
91,149
$
564
91,713
29,079
(191)
28,888
120,601
73,677
(2,795)
70,882
(2,409)
(33)
68,440
464
(1,665)
67,239
71,235
58.77 %
56.75 %
55.75 %
Tax-equivalent adjustments were calculated using an estimated federal income tax rate of 21%, applied to non-taxable interest income on investments and loans.
December 31,
2023
$ 319,451
$
Years Ended
2,173
321,624
$
122,384
2,199
124,583
446,207
$ 285,532
(10,432)
275,100
(3,760)
(568)
270,772
(461)
(8,999)
$ 261,312
281,204
61.65 %
60.68 %
58.56%
December 31,
2022
323,438
$
$
$
$
$
2,199
325,637
126,803
2,133
128,936
454,573
283,881
(11,628)
272,253
(2,996)
(214)
(1,327)
267,716
(61)
(6,333)
261,322
279,344
59.89 %
58.89%
57.49 %
43
BView entire presentation