Massachusetts Water Resources Authority (“MWRA”) Employees’ Retirement System
Data & Analytics Case Study
We sought to better understand the competitive positioning of e-commerce and brick-and-mortar pet food retailers during
the COVID-19 pandemic.
Key Questions
We reviewed consumer credit card panel data and leveraged a custom survey on US
consumers that we initiated during the COVID-19 pandemic to answer the following
questions:
●
What is the potential impact of e-commerce retailers on brick-and-mortar players?
Were there any material changes in the competitive landscape due to COVID-19-
related lockdowns and store closures?
Have pet food retailers experienced customer turnover?
Key Findings
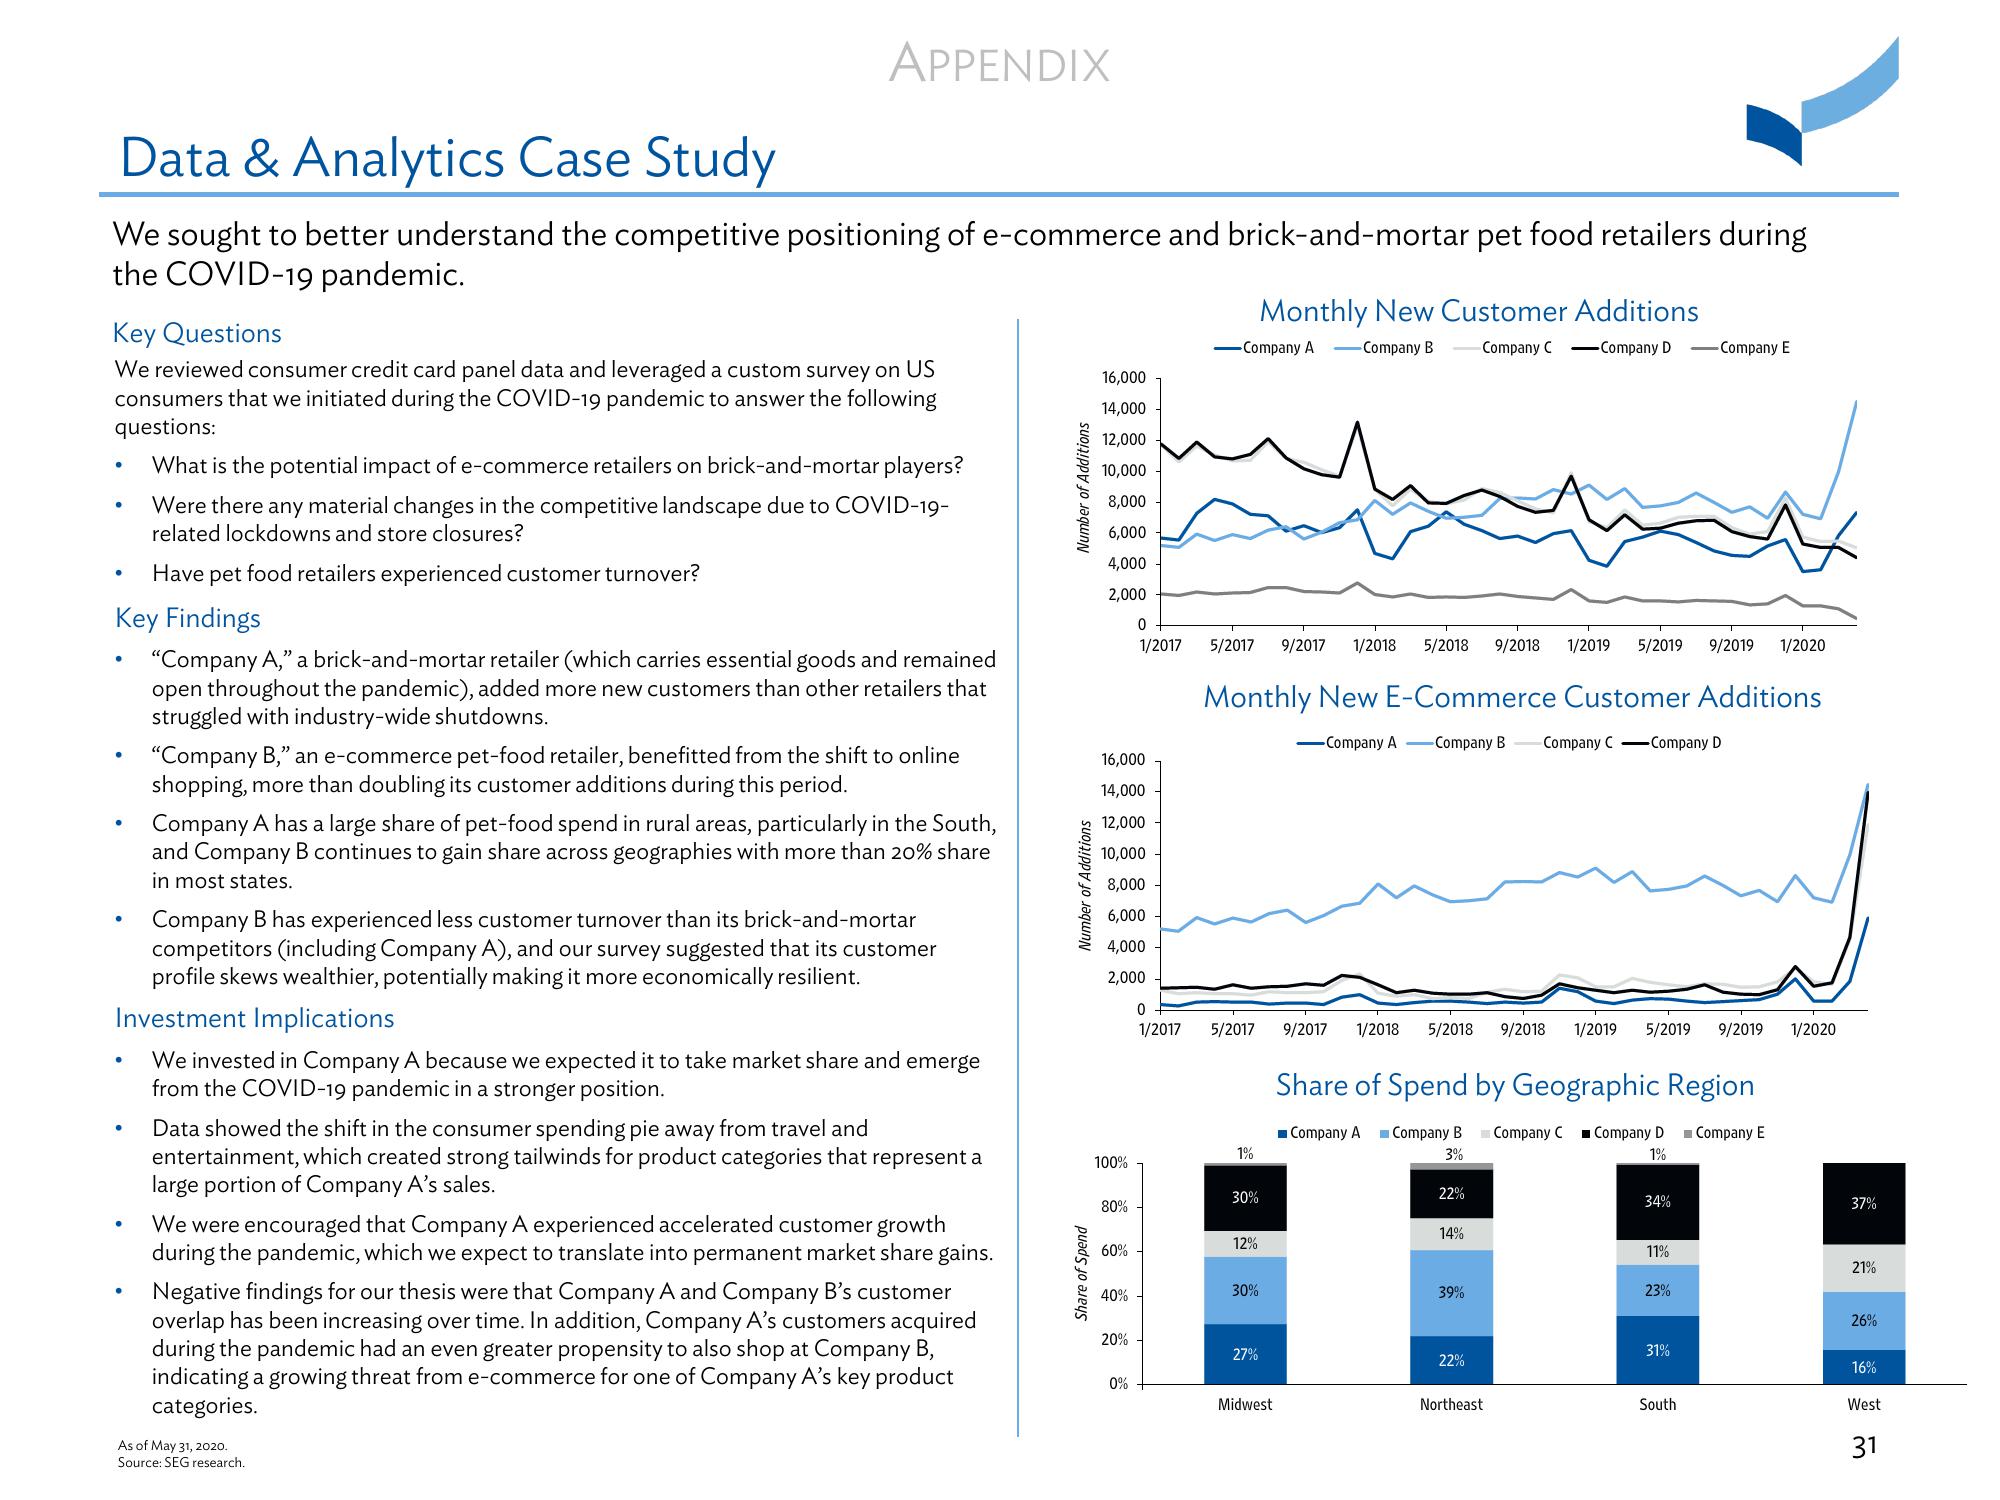
"Company A," a brick-and-mortar retailer (which carries essential goods and remained
open throughout the pandemic), added more new customers than other retailers that
struggled with industry-wide shutdowns.
APPENDIX
●
●
"Company B," an e-commerce pet-food retailer, benefitted from the shift to online
shopping, more than doubling its customer additions during this period.
Company A has a large share of pet-food spend in rural areas, particularly in the South,
and Company B continues to gain share across geographies with more than 20% share
in most states.
Company B has experienced less customer turnover than its brick-and-mortar
competitors (including Company A), and our survey suggested that its customer
profile skews wealthier, potentially making it more economically resilient.
Investment Implications
We invested in Company A because we expected it to take market share and emerge
from the COVID-19 pandemic in a stronger position.
Data showed the shift in the consumer spending pie away from travel and
entertainment, which created strong tailwinds for product categories that represent a
large portion of Company A's sales.
We were encouraged that Company A experienced accelerated customer growth
during the pandemic, which we expect to translate into permanent market share gains.
Negative findings for our thesis were that Company A and Company B's customer
overlap has been increasing over time. In addition, Company A's customers acquired
during the pandemic had an even greater propensity to also shop at Company B,
indicating a growing threat from e-commerce for one of Company A's key product
categories.
As of May 31, 2020.
Source: SEG research.
Number of Additions
Number of Additions
Share of Spend
16,000
14,000
12,000
10,000
8,000
6,000
4,000
2,000
16,000
14,000
12,000
10,000
8,000
6,000
4,000
2,000
100%
80%
60%
40%
20%
0
1/2017
0%
0
1/2017
Monthly New Customer Additions
-Company A -Company B
5/2017 9/2017 1/2018 5/2018 9/2018 1/2019 5/2019 9/2019 1/2020
Monthly New E-Commerce Customer Additions
-Company A Company B Company C-Company D
5/2017
1%
30%
12%
30%
27%
Midwest
9/2017 1/2018 5/2018 9/2018 1/2019 5/2019 9/2019
Share of Spend by Geographic Region
Company A Company B
3%
Company D Company E
1%
22%
Company C-Company D-Company E
14%
39%
22%
Northeast
Company C
34%
11%
23%
31%
South
1/2020
37%
21%
26%
16%
West
31View entire presentation