Freshworks Investor Day Presentation Deck
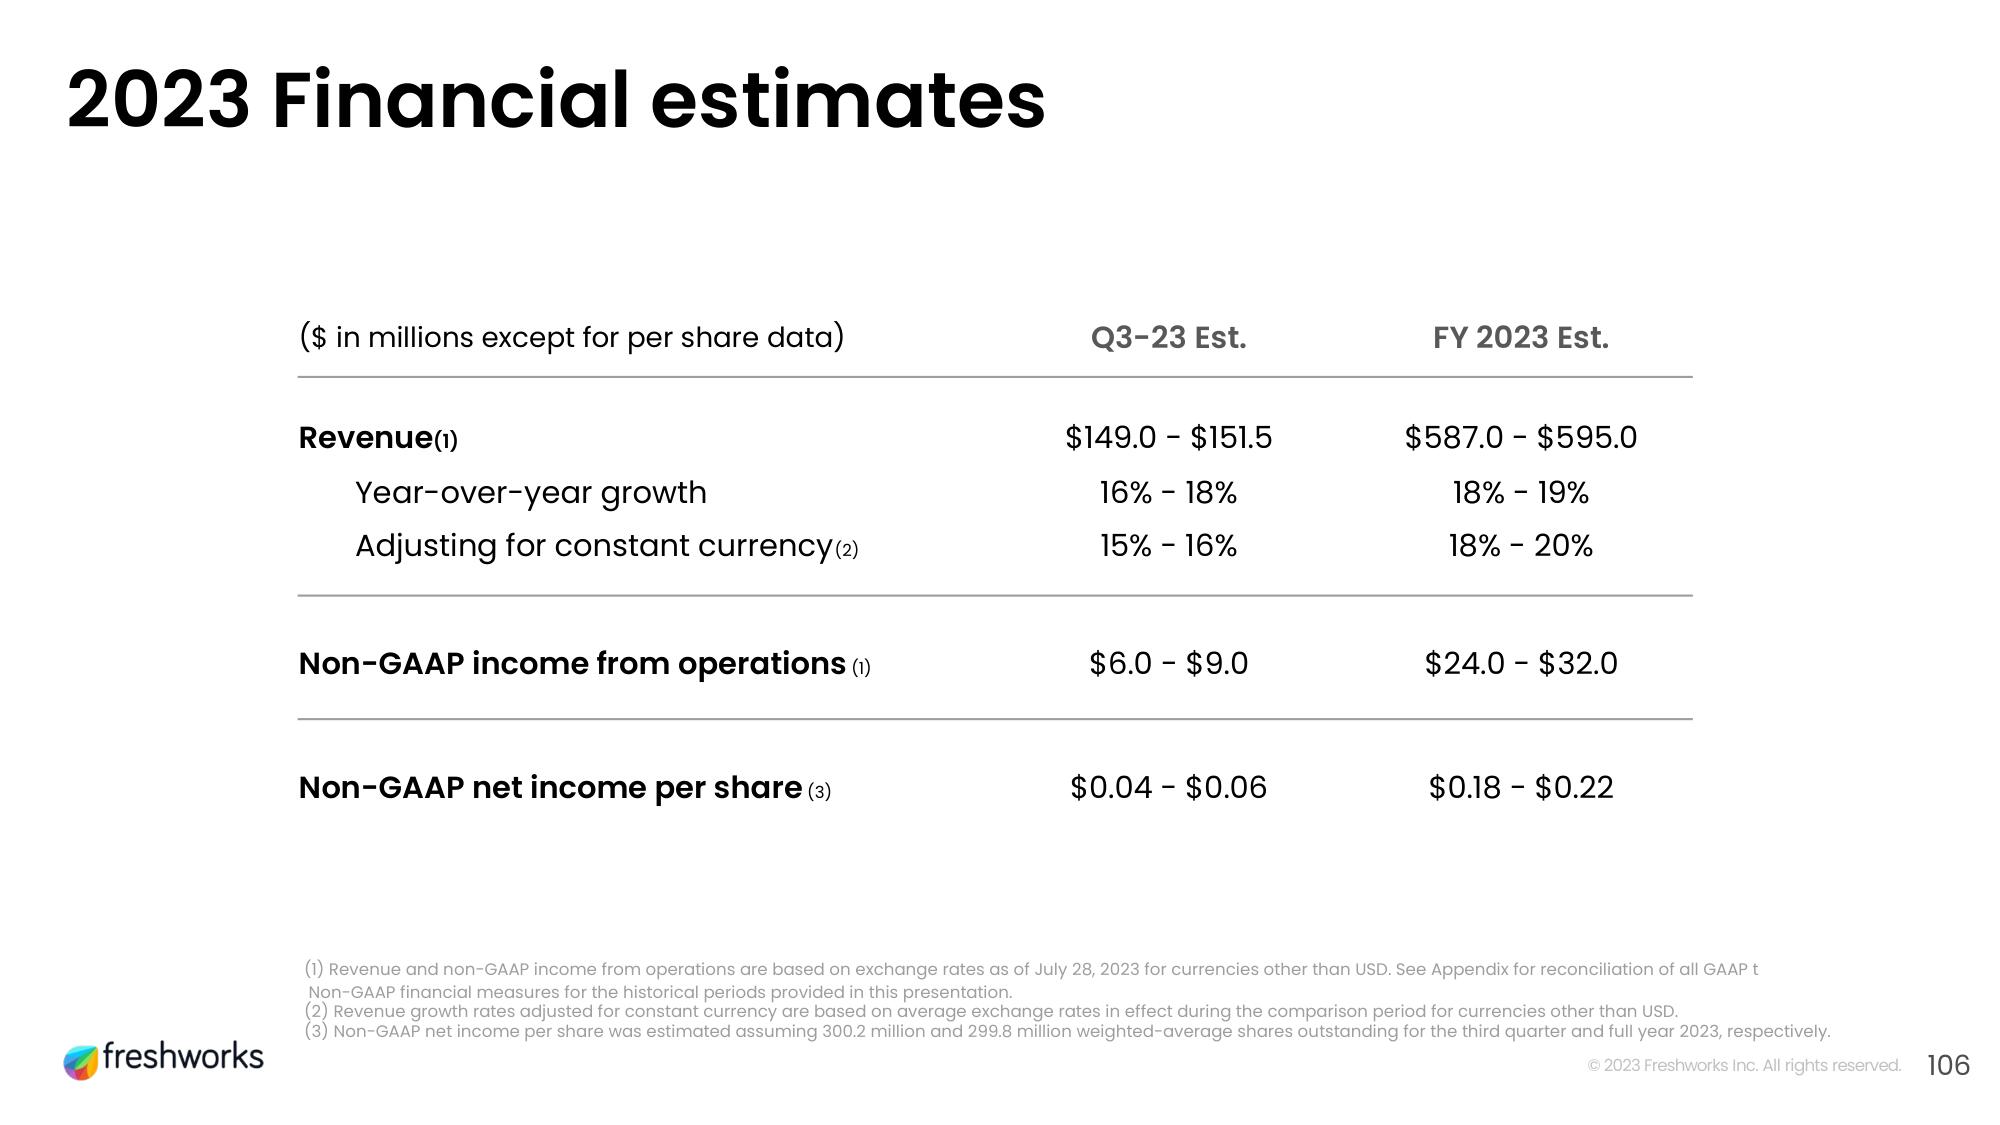
2023 Financial estimates
freshworks
($ in millions except for per share data)
Revenue (1)
Year-over-year growth
Adjusting for constant currency (2)
Non-GAAP income from operations (1)
Non-GAAP net income per share (3)
Q3-23 Est.
$149.0 $151.5
16% - 18%
15% - 16%
$6.0 - $9.0
$0.04 $0.06
FY 2023 Est.
$587.0 $595.0
18% - 19%
18% - 20%
$24.0 $32.0
$0.18 - $0.22
(1) Revenue and non-GAAP income from operations are based on exchange rates as of July 28, 2023 for currencies other than USD. See Appendix for reconciliation of all GAAP t
Non-GAAP financial measures for the historical periods provided in this presentation.
(2) Revenue growth rates adjusted for constant currency are based on average exchange rates in effect during the comparison period for currencies other than USD.
(3) Non-GAAP net income per share was estimated assuming 300.2 million and 299.8 million weighted-average shares outstanding for the third quarter and full year 2023, respectively.
Ⓒ2023 Freshworks Inc. All rights reserved.
106View entire presentation