Community Solar Deployment and Subscriptions
Cumulative MWac
4,000
Community Solar Capacity in Operation and
Planned in Top States
Community Solar Capacity in Queue - Key States
3,500
3,000
2008
2506
2,500
2,000
1,500
1,000 2010
Operational
Planned
Solar DC output capacity
has been converted to AC-
rated output based on 1.3
DC/AC ratio.
317
248
1352
500
924 880 439
213
366
309
162 119 257
200
0
150
88
-37 28
FL
NY
MN
MA
IL
CO
MD
HI*
NM
NJ
OR
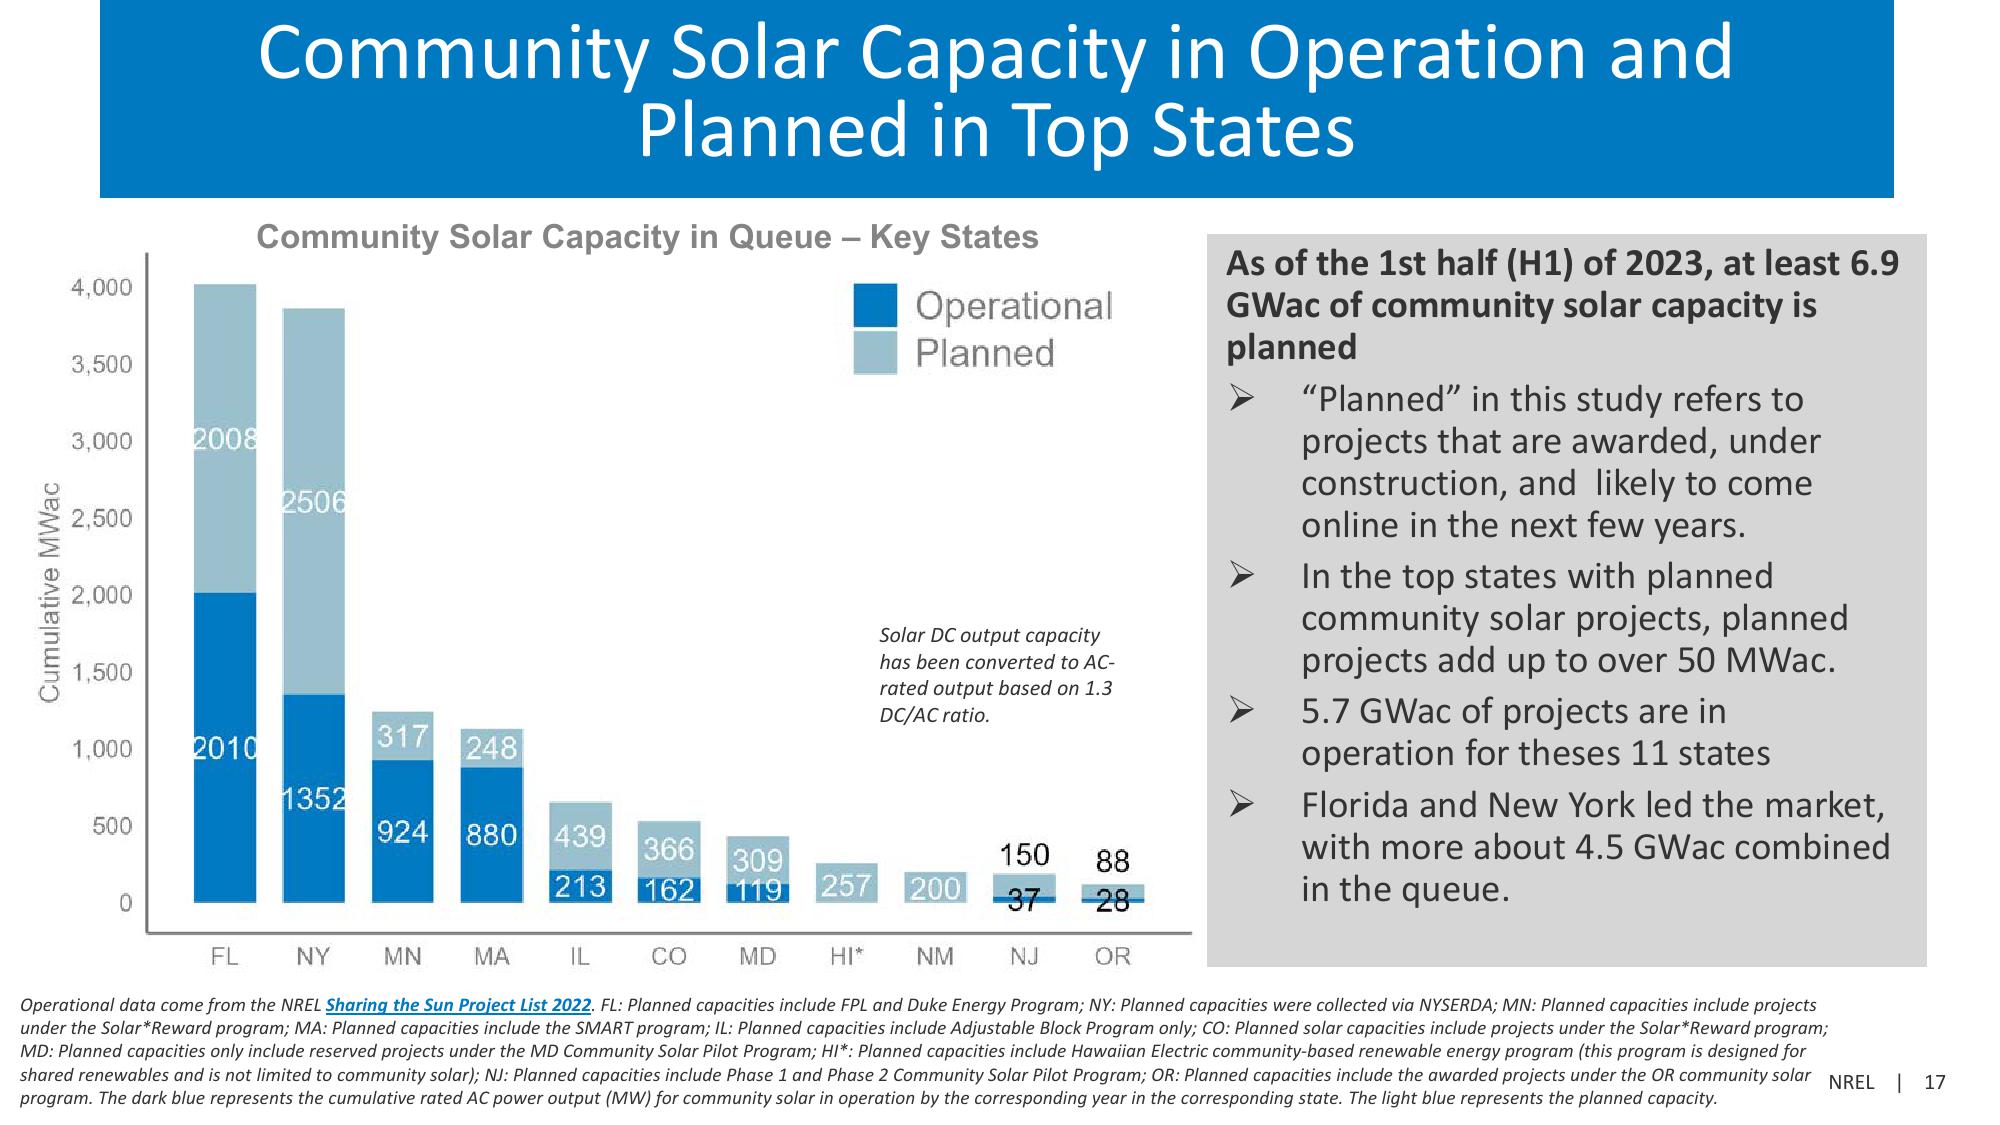
As of the 1st half (H1) of 2023, at least 6.9
GWac of community solar capacity is
planned
"Planned" in this study refers to
projects that are awarded, under
construction, and likely to come
online in the next few years.
In the top states with planned
community solar projects, planned
projects add up to over 50 MWac.
5.7 GWac of projects are in
operation for theses 11 states
Florida and New York led the market,
with more about 4.5 GWac combined
in the queue.
Operational data come from the NREL Sharing the Sun Project List 2022. FL: Planned capacities include FPL and Duke Energy Program; NY: Planned capacities were collected via NYSERDA; MN: Planned capacities include projects
under the Solar* Reward program; MA: Planned capacities include the SMART program; IL: Planned capacities include Adjustable Block Program only; CO: Planned solar capacities include projects under the Solar* Reward program;
MD: Planned capacities only include reserved projects under the MD Community Solar Pilot Program; HI*: Planned capacities include Hawaiian Electric community-based renewable energy program (this program is designed for
shared renewables and is not limited to community solar); NJ: Planned capacities include Phase 1 and Phase 2 Community Solar Pilot Program; OR: Planned capacities include the awarded projects under the OR community solar NREL | 17
program. The dark blue represents the cumulative rated AC power output (MW) for community solar in operation by the corresponding year in the corresponding state. The light blue represents the planned capacity.View entire presentation