Maersk Investor Presentation Deck
1
A more profitable and resilient Ocean
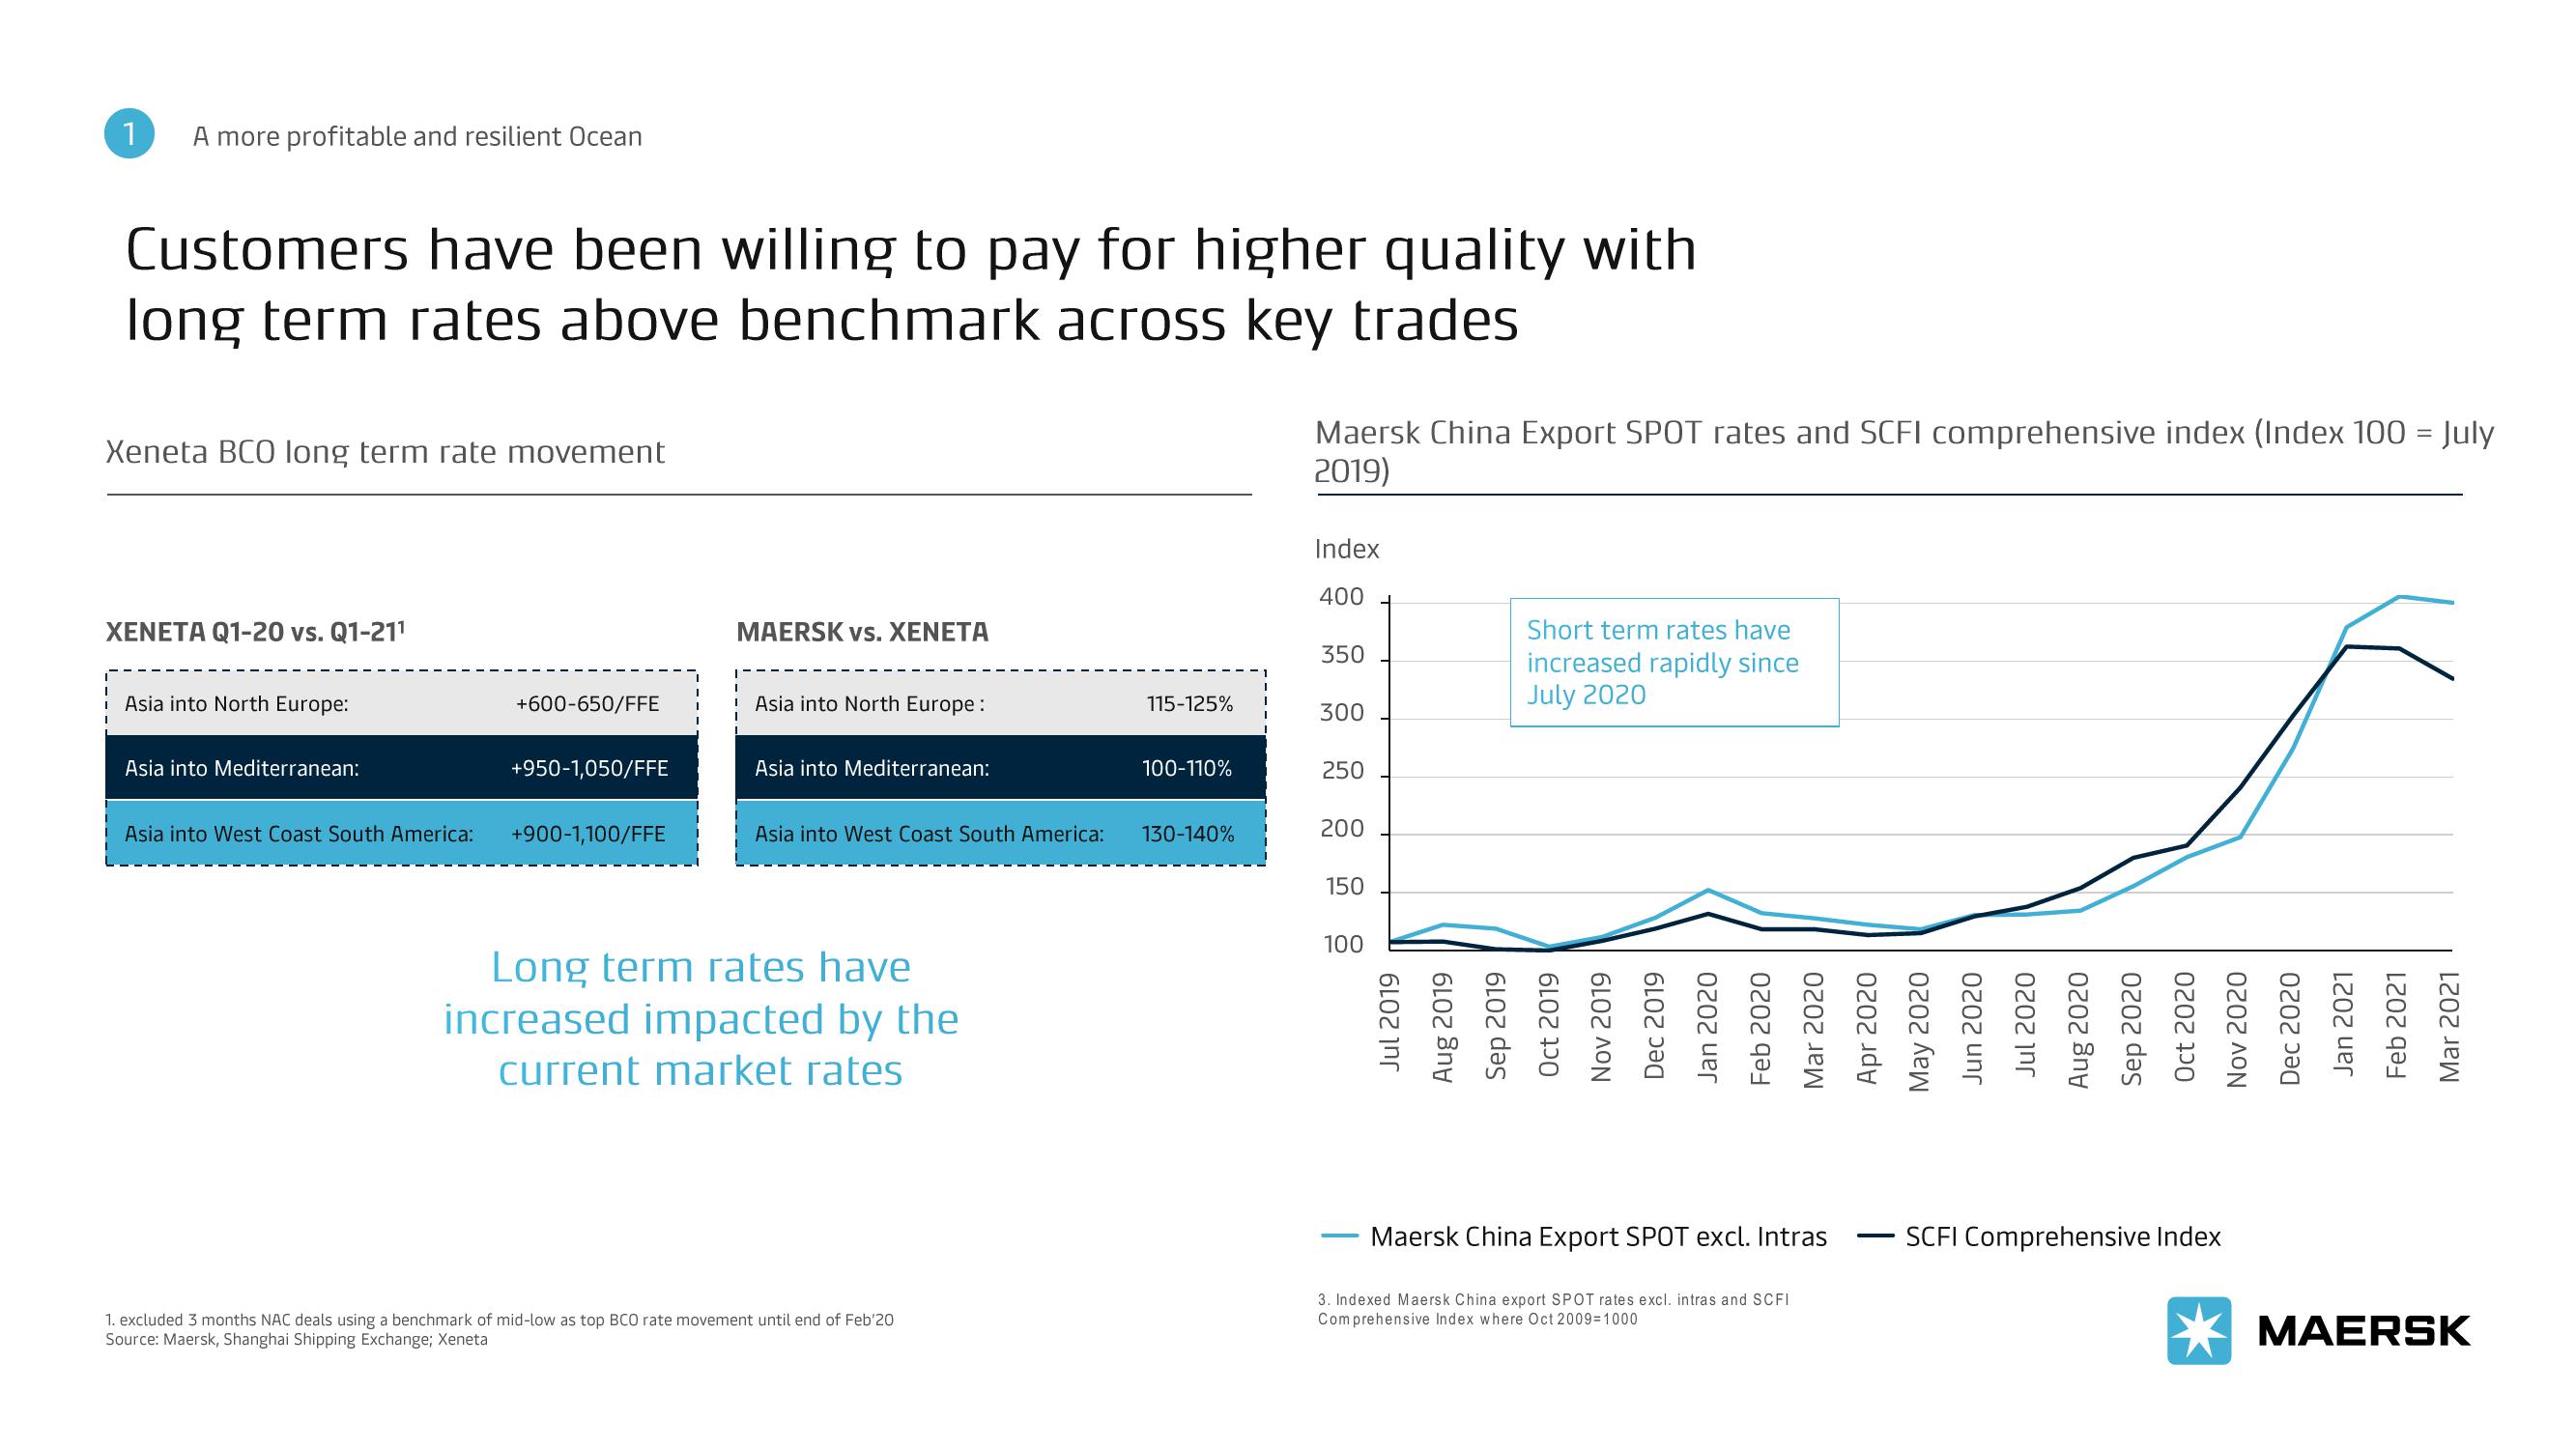
Customers have been willing to pay for higher quality with
long term rates above benchmark across key trades
Xeneta BCO long term rate movement
XENETA Q1-20 vs. Q1-21¹
Asia into North Europe:
Asia into Mediterranean:
Asia into West Coast South America:
+600-650/FFE
+950-1,050/FFE
+900-1,100/FFE
MAERSK vs. XENETA
Asia into North Europe:
Asia into Mediterranean:
Asia into West Coast South America:
Long term rates have
increased impacted by the
current market rates
1. excluded 3 months NAC deals using a benchmark of mid-low as top BCO rate movement until end of Feb'20
Source: Maersk, Shanghai Shipping Exchange; Xeneta
115-125%
100-110%
130-140%
Maersk China Export SPOT rates and SCFI comprehensive index (Index 100 = July
2019)
Index
400
350
300
250
200
150
100
Short term rates have
increased rapidly since
July 2020
Jul 2019
2019
Sep 2019
Oct 2019
Nov 2019
Dec 2019
Jan 2020
Feb 2020
Mar 2020
Apr 2020
May 2020
Jun 2020
Jul 2020
Aug 2020
Sep 2020
Oct 2020
Aug
Nov 2020
Dec 2020
Jan 2021
Feb 2021
Mar 2021
Maersk China Export SPOT excl. Intras
3. Indexed Maersk China export SPOT rates excl. intras and SCFI
Comprehensive Index where Oct 2009=1000
SCFI Comprehensive Index
MAERSKView entire presentation