Allwyn Results Presentation Deck
Strong free cash flow generation
Reflects asset light business model and high profitability
●
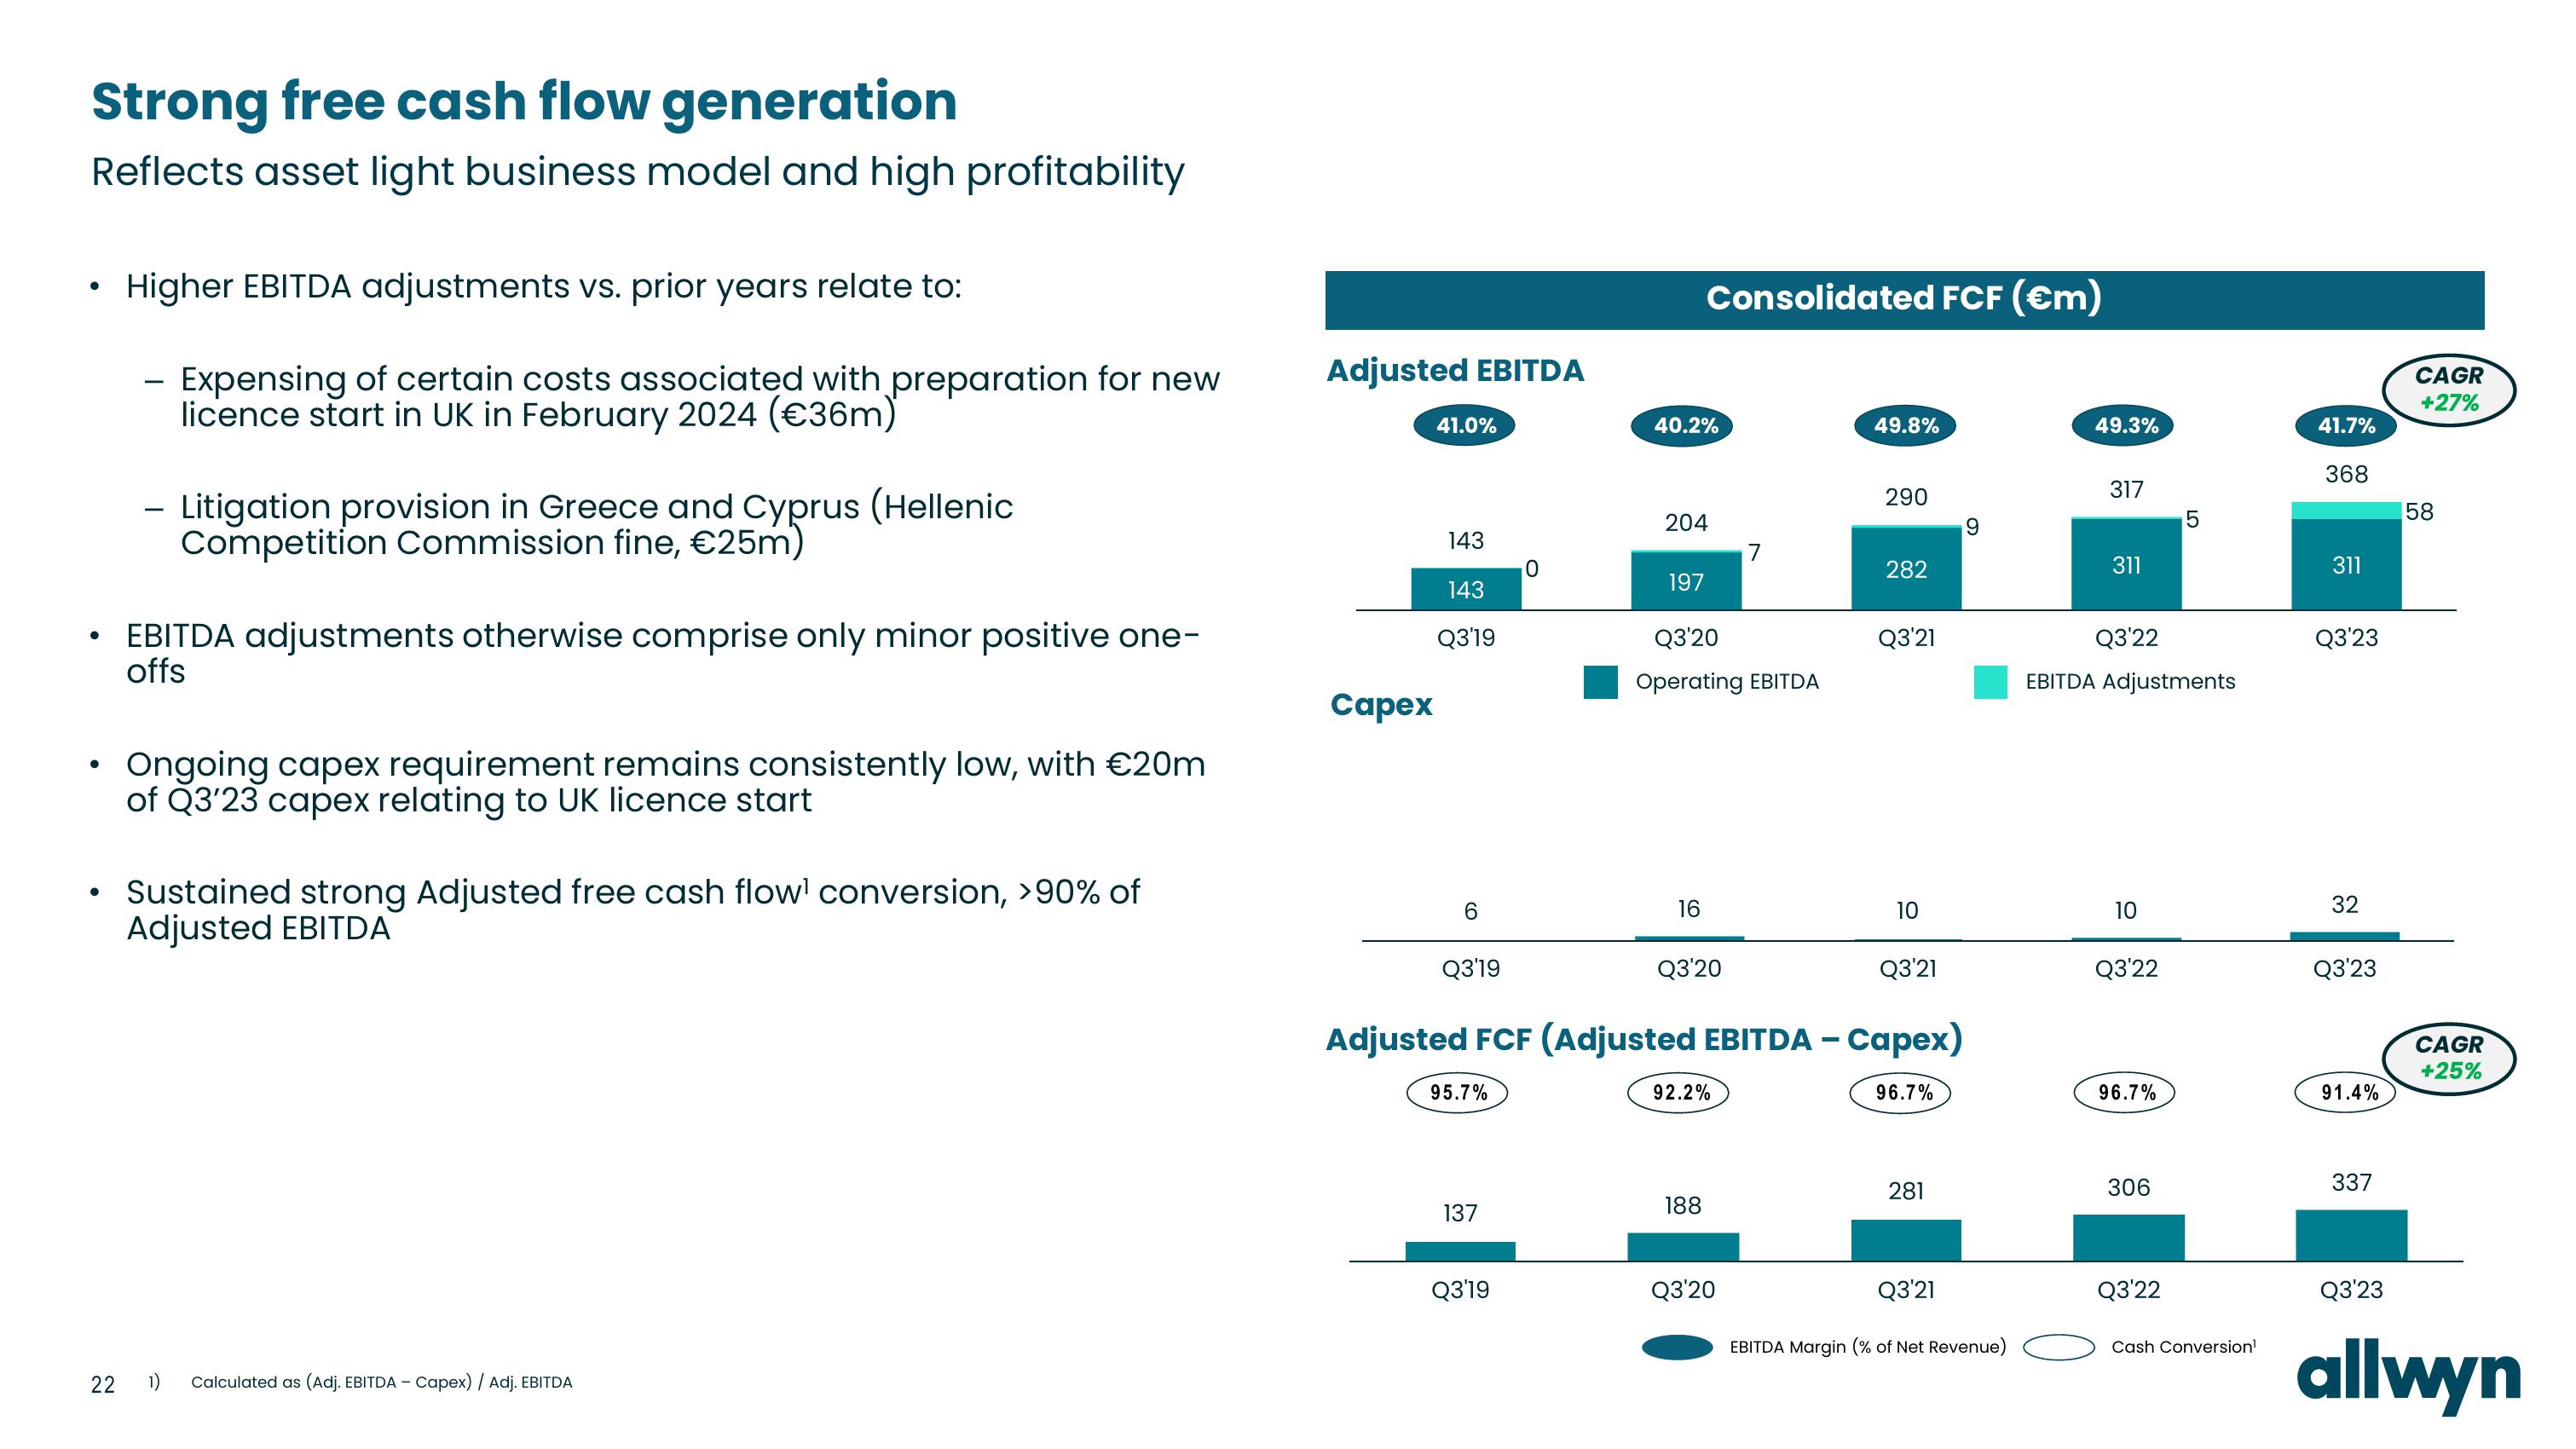
Higher EBITDA adjustments vs. prior years relate to:
Expensing of certain costs associated with preparation for new
licence start in UK in February 2024 (€36m)
- Litigation provision in Greece and Cyprus (Hellenic
Competition Commission fine, €25m)
• EBITDA adjustments otherwise comprise only minor positive one-
offs
●
• Ongoing capex requirement remains consistently low, with €20m
of Q3'23 capex relating to UK licence start
Sustained strong Adjusted free cash flow conversion, >90% of
Adjusted EBITDA
22 1)
Calculated as (Adj. EBITDA - Capex) / Adj. EBITDA
Adjusted EBITDA
Capex
41.0%
143
143
Q3'19
6
Q3'19
95.7%
137
0
Q3'19
40.2%
204
197
Consolidated FCF (€m)
16
Q3'20
Operating EBITDA
Q3'20
92.2%
188
7
Q3'20
49.8%
Adjusted FCF (Adjusted EBITDA - Capex)
96.7%
290
282
Q3'21
10
Q3'21
281
9
Q3'21
EBITDA Margin (% of Net Revenue)
49.3%
317
311
Q3'22
EBITDA Adjustments
10
Q3'22
96.7%
306
5
Q3'22
Cash Conversion¹
41.7%
368
311
Q3'23
32
Q3'23
91.4%
337
Q3'23
CAGR
+27%
58
CAGR
+25%
allwynView entire presentation