Summer 2023 Solar Industry Update
PV Annual Installations (GWdc)
70
50
40
262220
30
10
IRA-Induced Growth
Projections
2022
Pre-IRA
2023P
2024P
IImmediately Post-IRA
11
2025P
I Current Post-IRA
2026P
2027P
SFS (Decarb+E)
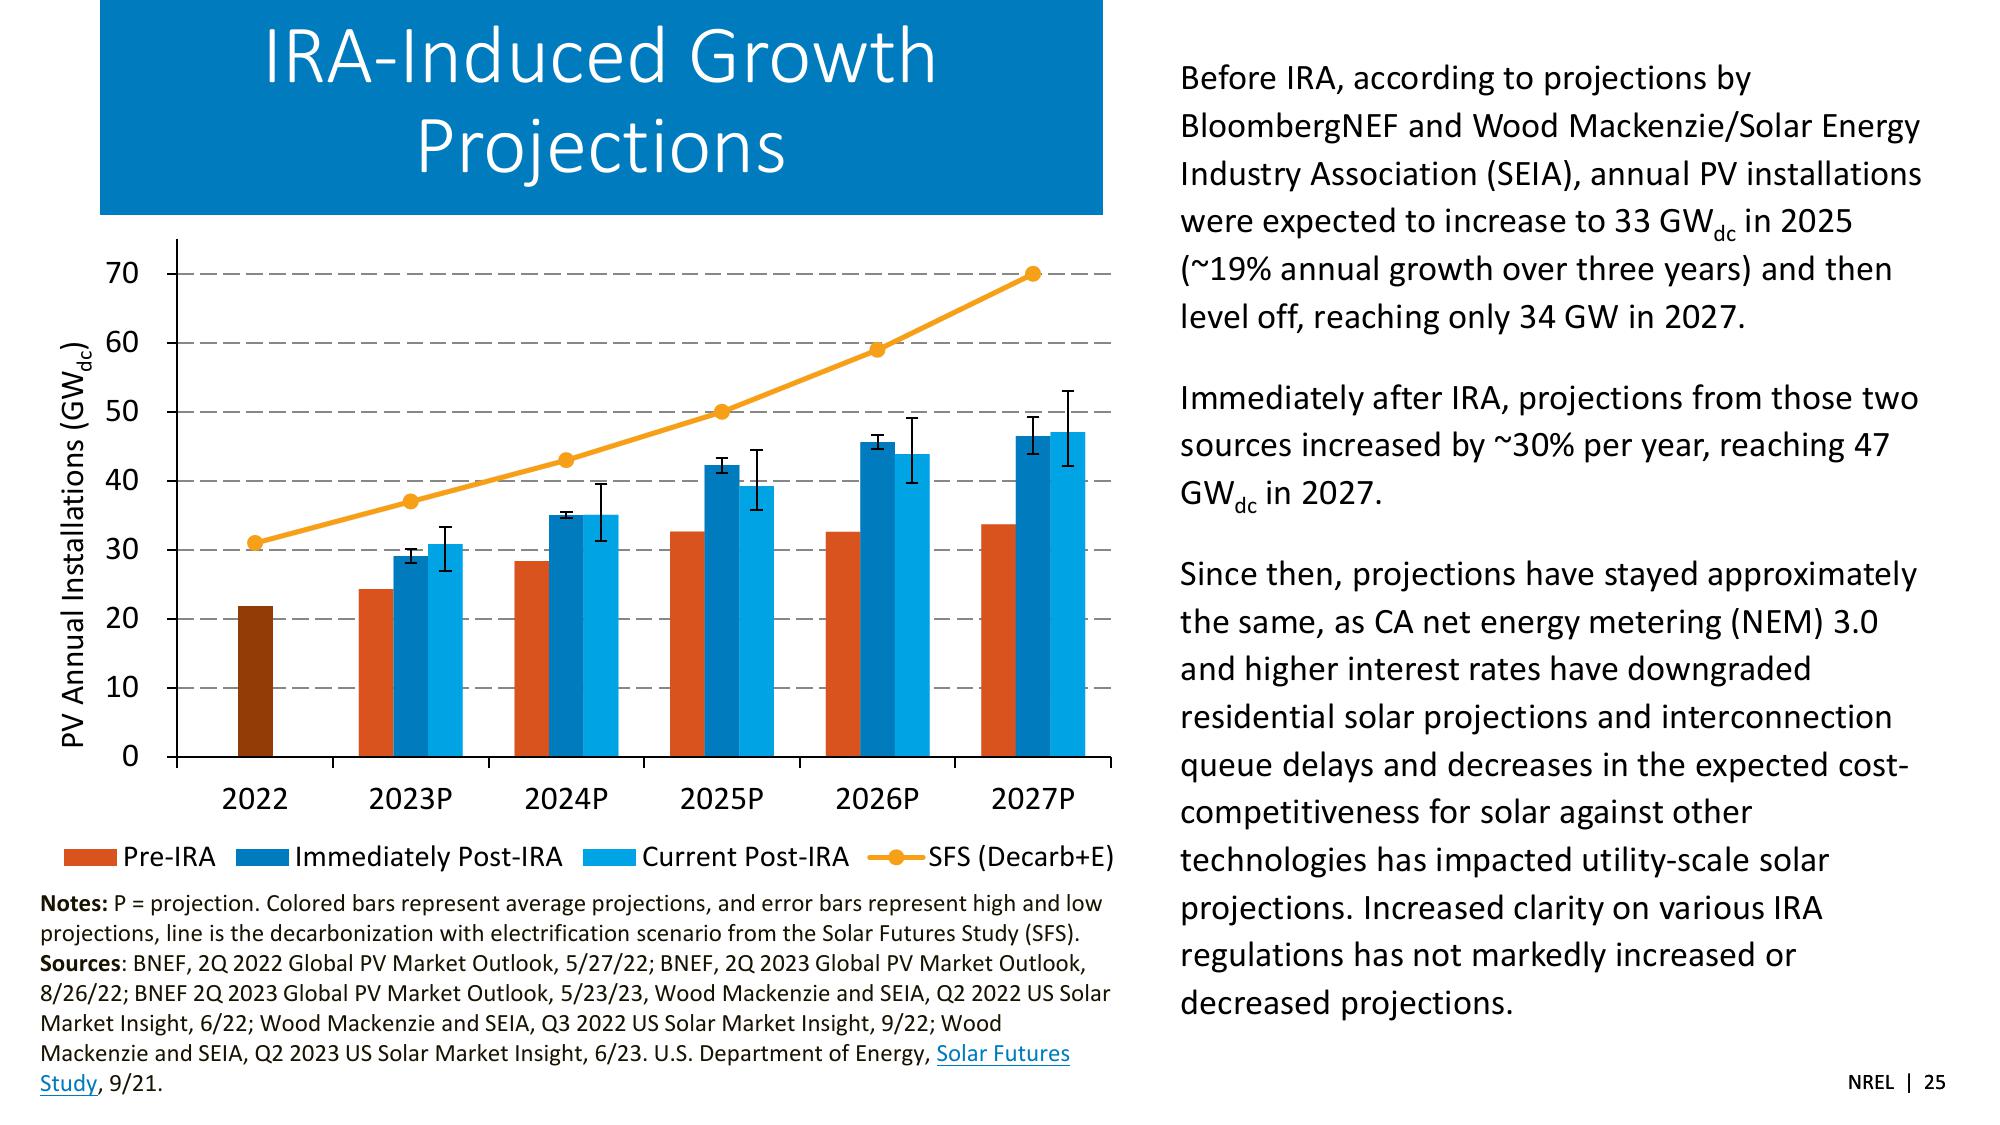
Notes: P = projection. Colored bars represent average projections, and error bars represent high and low
projections, line is the decarbonization with electrification scenario from the Solar Futures Study (SFS).
Sources: BNEF, 2Q 2022 Global PV Market Outlook, 5/27/22; BNEF, 2Q 2023 Global PV Market Outlook,
8/26/22; BNEF 2Q 2023 Global PV Market Outlook, 5/23/23, Wood Mackenzie and SEIA, Q2 2022 US Solar
Market Insight, 6/22; Wood Mackenzie and SEIA, Q3 2022 US Solar Market Insight, 9/22; Wood
Mackenzie and SEIA, Q2 2023 US Solar Market Insight, 6/23. U.S. Department of Energy, Solar Futures
Study, 9/21.
Before IRA, according to projections by
BloombergNEF and Wood Mackenzie/Solar Energy
Industry Association (SEIA), annual PV installations
were expected to increase to 33 GW in 2025
(~19% annual growth over three years) and then
level off, reaching only 34 GW in 2027.
dc
Immediately after IRA, projections from those two
sources increased by ~30% per year, reaching 47
GWd in 2027.
dc
Since then, projections have stayed approximately
the same, as CA net energy metering (NEM) 3.0
and higher interest rates have downgraded
residential solar projections and interconnection
queue delays and decreases in the expected cost-
competitiveness for solar against other
technologies has impacted utility-scale solar
projections. Increased clarity on various IRA
regulations has not markedly increased or
decreased projections.
NREL | 25View entire presentation