First Quarter 2017 Financial Review
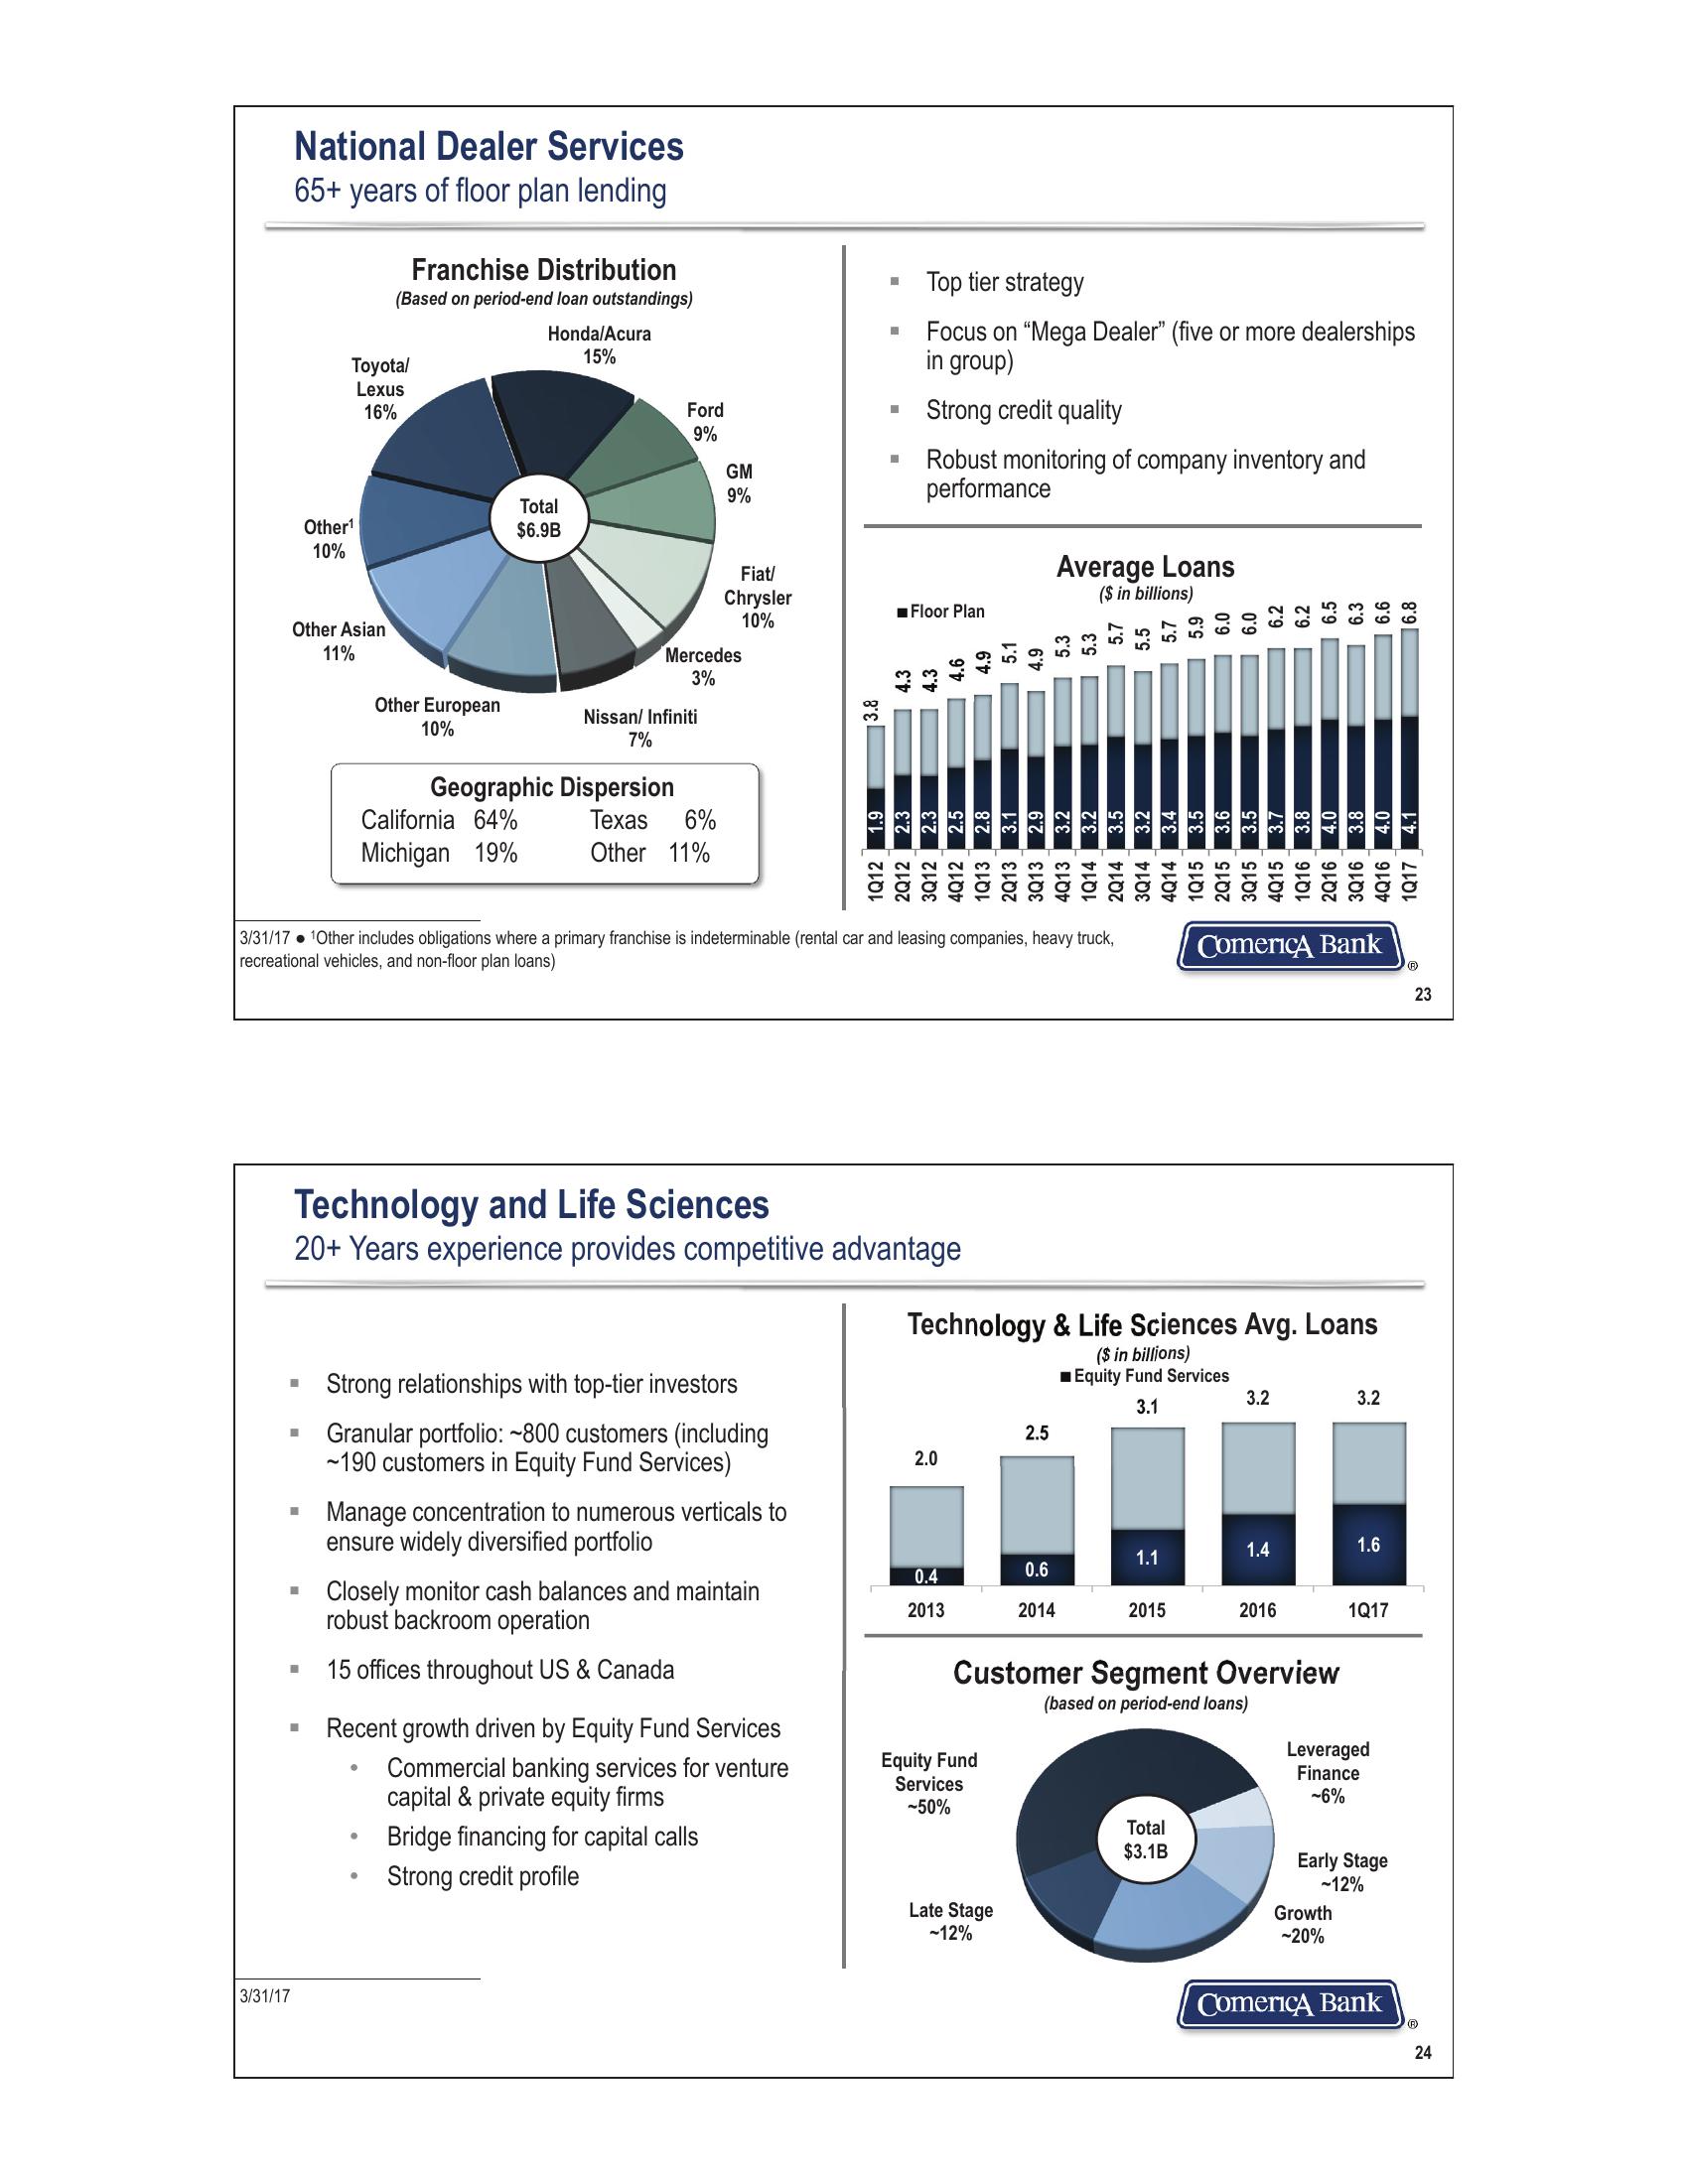
National Dealer Services
65+ years of floor plan lending
Franchise Distribution
(Based on period-end loan outstandings)
Toyota/
Lexus
16%
Honda/Acura
15%
Ford
9%
Other¹
10%
Total
$6.9B
GM
៩៖
9%
Fiat/
Chrysler
☐
■
Top tier strategy
Focus on "Mega Dealer" (five or more dealerships
in group)
Strong credit quality
Robust monitoring of company inventory and
performance
Other Asian
10%
■Floor Plan
11%
Mercedes
3%
Other European
10%
3333
Nissan/Infiniti
7%
3.8
Geographic Dispersion
California 64%
Texas
6%
Michigan 19%
Other 11%
Average Loans
($ in billions)
1Q12
1.9 -
2Q12
2.3
3Q12
2.3
4Q12 2.5
1Q13
2.8
2Q13
3.1
5.1
3Q13 2.9
4.9
4Q13 3.2
1Q14 3.2
5.3
2Q14 3.5
5.7
3Q14 3.2
5.5
4Q14 3.4
5.7
1Q15 3.5
5.9
2Q15 3.6
6.0
3Q15 3.5
6.0
4Q15
3.7
6.2
1Q16 3.8
6.2
2Q16 4.0
6.5
3Q16 3.8
6.3
4Q16 | 4.0
6.6
1Q17
4.1
16.8
3/31/17 1Other includes obligations where a primary franchise is indeterminable (rental car and leasing companies, heavy truck,
recreational vehicles, and non-floor plan loans)
3/31/17
Technology and Life Sciences
Comerica Bank
23
20+ Years experience provides competitive advantage
Technology & Life Sciences Avg. Loans
Strong relationships with top-tier investors
Granular portfolio: ~800 customers (including
~190 customers in Equity Fund Services)
Manage concentration to numerous verticals to
ensure widely diversified portfolio
■ Closely monitor cash balances and maintain
robust backroom operation
2.5
2.0
($ in billions)
■Equity Fund Services
3.2
3.2
3.1
1.4
1.6
1.1
0.4
2013
0.6
2014
2015
2016 1Q17
Customer Segment Overview
(based on period-end loans)
15 offices throughout US & Canada
Recent growth driven by Equity Fund Services
•
Commercial banking services for venture
capital & private equity firms
Equity Fund
Services
-50%
•
Bridge financing for capital calls
Strong credit profile
Late Stage
-12%
Total
$3.1B
Leveraged
Finance
-6%
Early Stage
-12%
Growth
-20%
Comerica Bank
Ⓡ
24View entire presentation