Liberty Global Results Presentation Deck
(1)
(3)
(4)
(5)
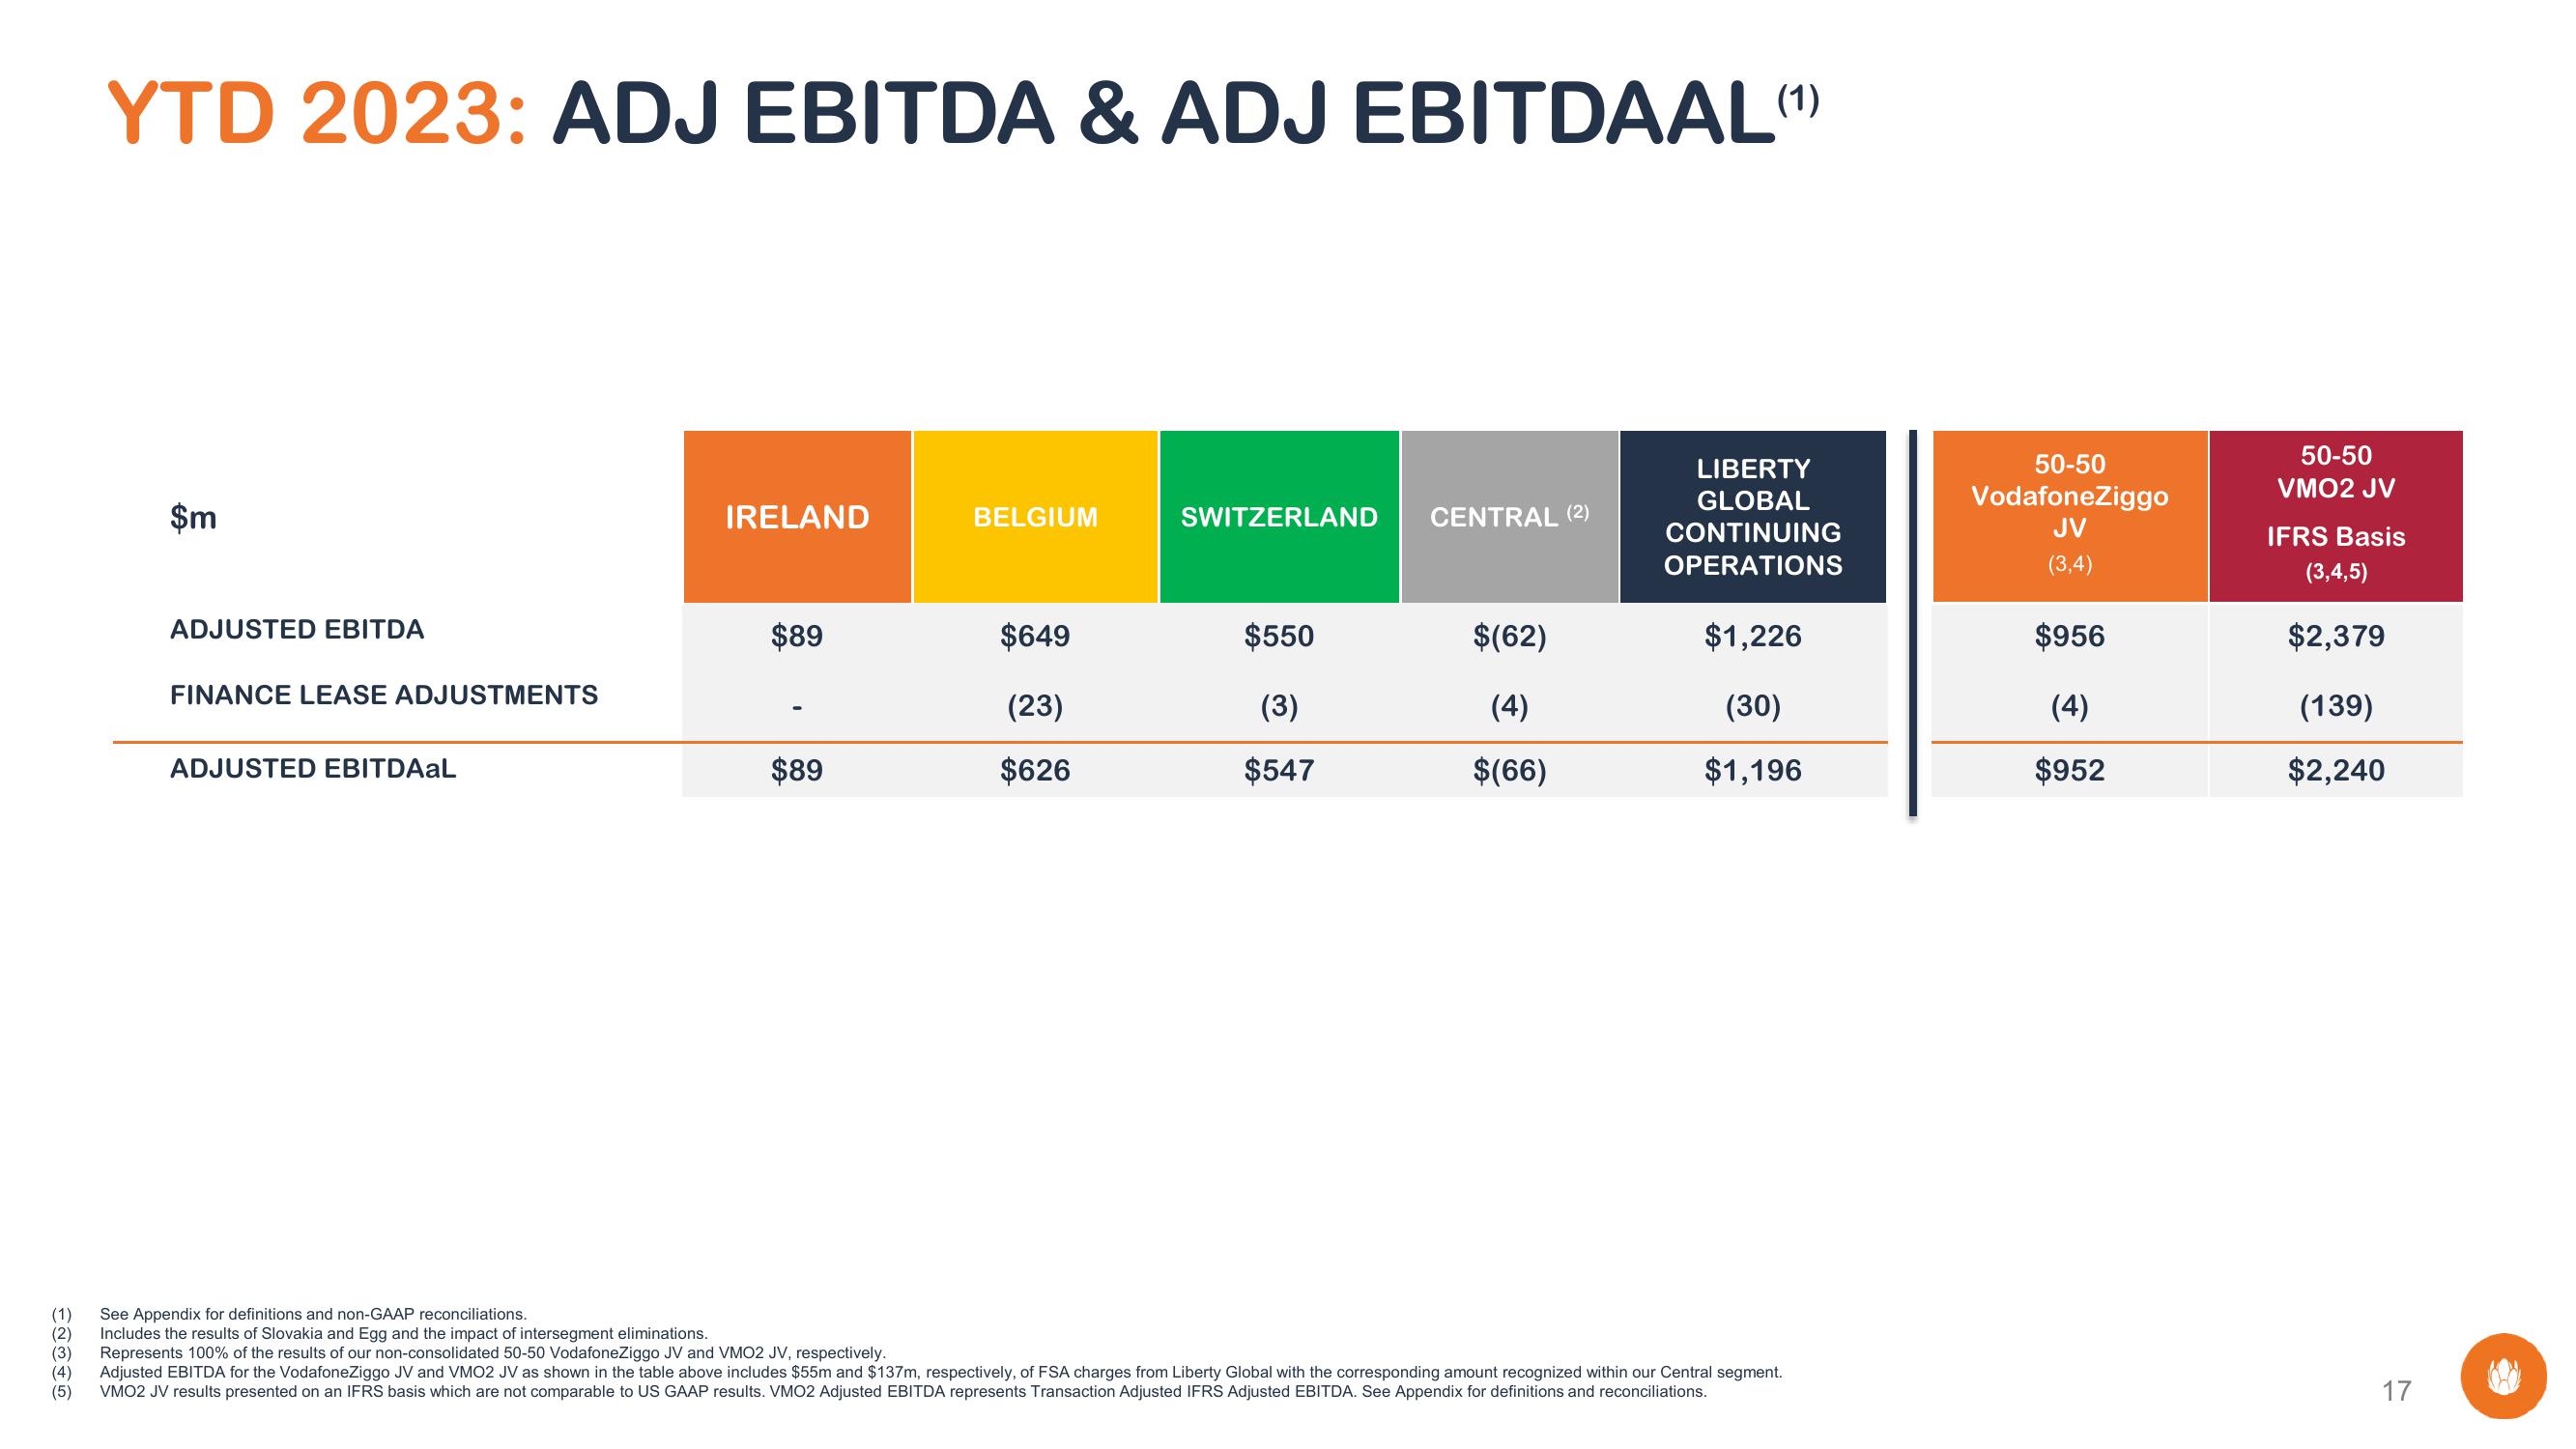
YTD 2023: ADJ EBITDA & ADJ EBITDAAL (¹)
$m
ADJUSTED EBITDA
FINANCE LEASE ADJUSTMENTS
ADJUSTED EBITDAAL
IRELAND
$89
$89
BELGIUM
$649
(23)
$626
SWITZERLAND CENTRAL (2)
$550
(3)
$547
$(62)
(4)
$(66)
LIBERTY
GLOBAL
CONTINUING
OPERATIONS
$1,226
(30)
$1,196
See Appendix for definitions and non-GAAP reconciliations.
Includes the results of Slovakia and Egg and the impact of intersegment eliminations.
Represents 100% of the results of our non-consolidated 50-50 VodafoneZiggo JV and VMO2 JV, respectively.
Adjusted EBITDA for the VodafoneZiggo JV and VMO2 JV as shown in the table above includes $55m and $137m, respectively, of FSA charges from Liberty Global with the corresponding amount recognized within our Central segment.
VMO2 JV results presented on an IFRS basis which are not comparable to US GAAP results. VMO2 Adjusted EBITDA represents Transaction Adjusted IFRS Adjusted EBITDA. See Appendix for definitions and reconciliations.
50-50
VodafoneZiggo
JV
(3,4)
$956
(4)
$952
50-50
VMO2 JV
IFRS Basis
(3,4,5)
$2,379
(139)
$2,240
17
(80View entire presentation