FIGS Results Presentation Deck
($ in millions, unaudited)
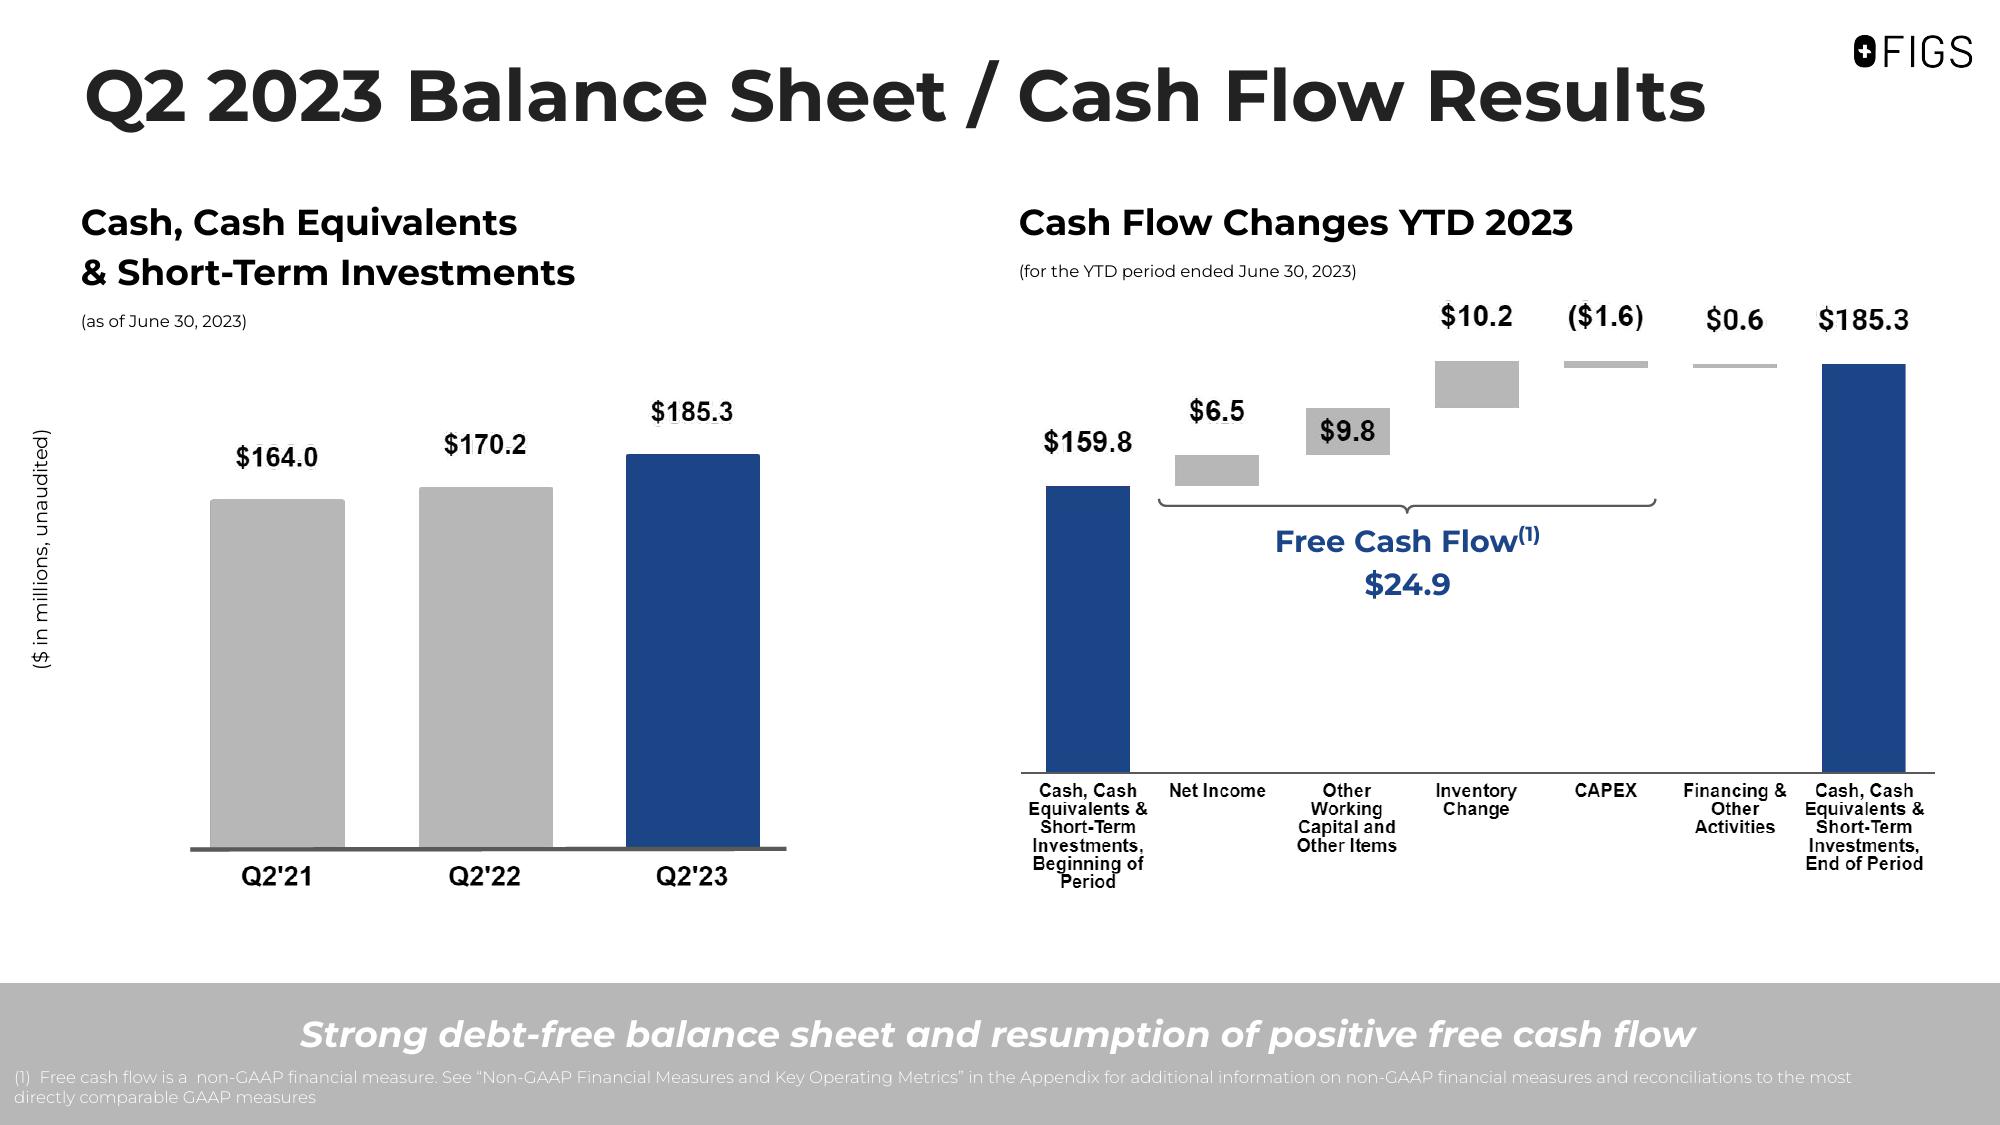
Q2 2023 Balance Sheet/Cash Flow Results
Cash, Cash Equivalents
& Short-Term Investments
(as of June 30, 2023)
$164.0
Q2'21
$170.2
Q2'22
$185.3
Q2'23
Cash Flow Changes YTD 2023
(for the YTD period ended June 30, 2023)
$159.8
Cash, Cash
Equivalents &
Short-Term
Investments,
Beginning of
Period
$6.5
Net Income
$9.8
$10.2 ($1.6) $0.6
Free Cash Flow(¹)
$24.9
Other
Working
Capital and
Other Items
Inventory
Change
CAPEX
Financing &
Other
Activities
OFIGS
$185.3
Cash, Cash
Equivalents &
Short-Term
Investments,
End of Period
Strong debt-free balance sheet and resumption of positive free cash flow
(1) Free cash flow is a non-GAAP financial measure. See "Non-GAAP Financial Measures and Key Operating Metrics" in the Appendix for additional information on non-GAAP financial measures and reconciliations to the most
directly comparable GAAP measuresView entire presentation