Endeavour Mining Investor Presentation Deck
LAFIGUÉ PROJECT
Côte D'Ivoire
ATTRACTIVE PROJECT
ECONOMICS
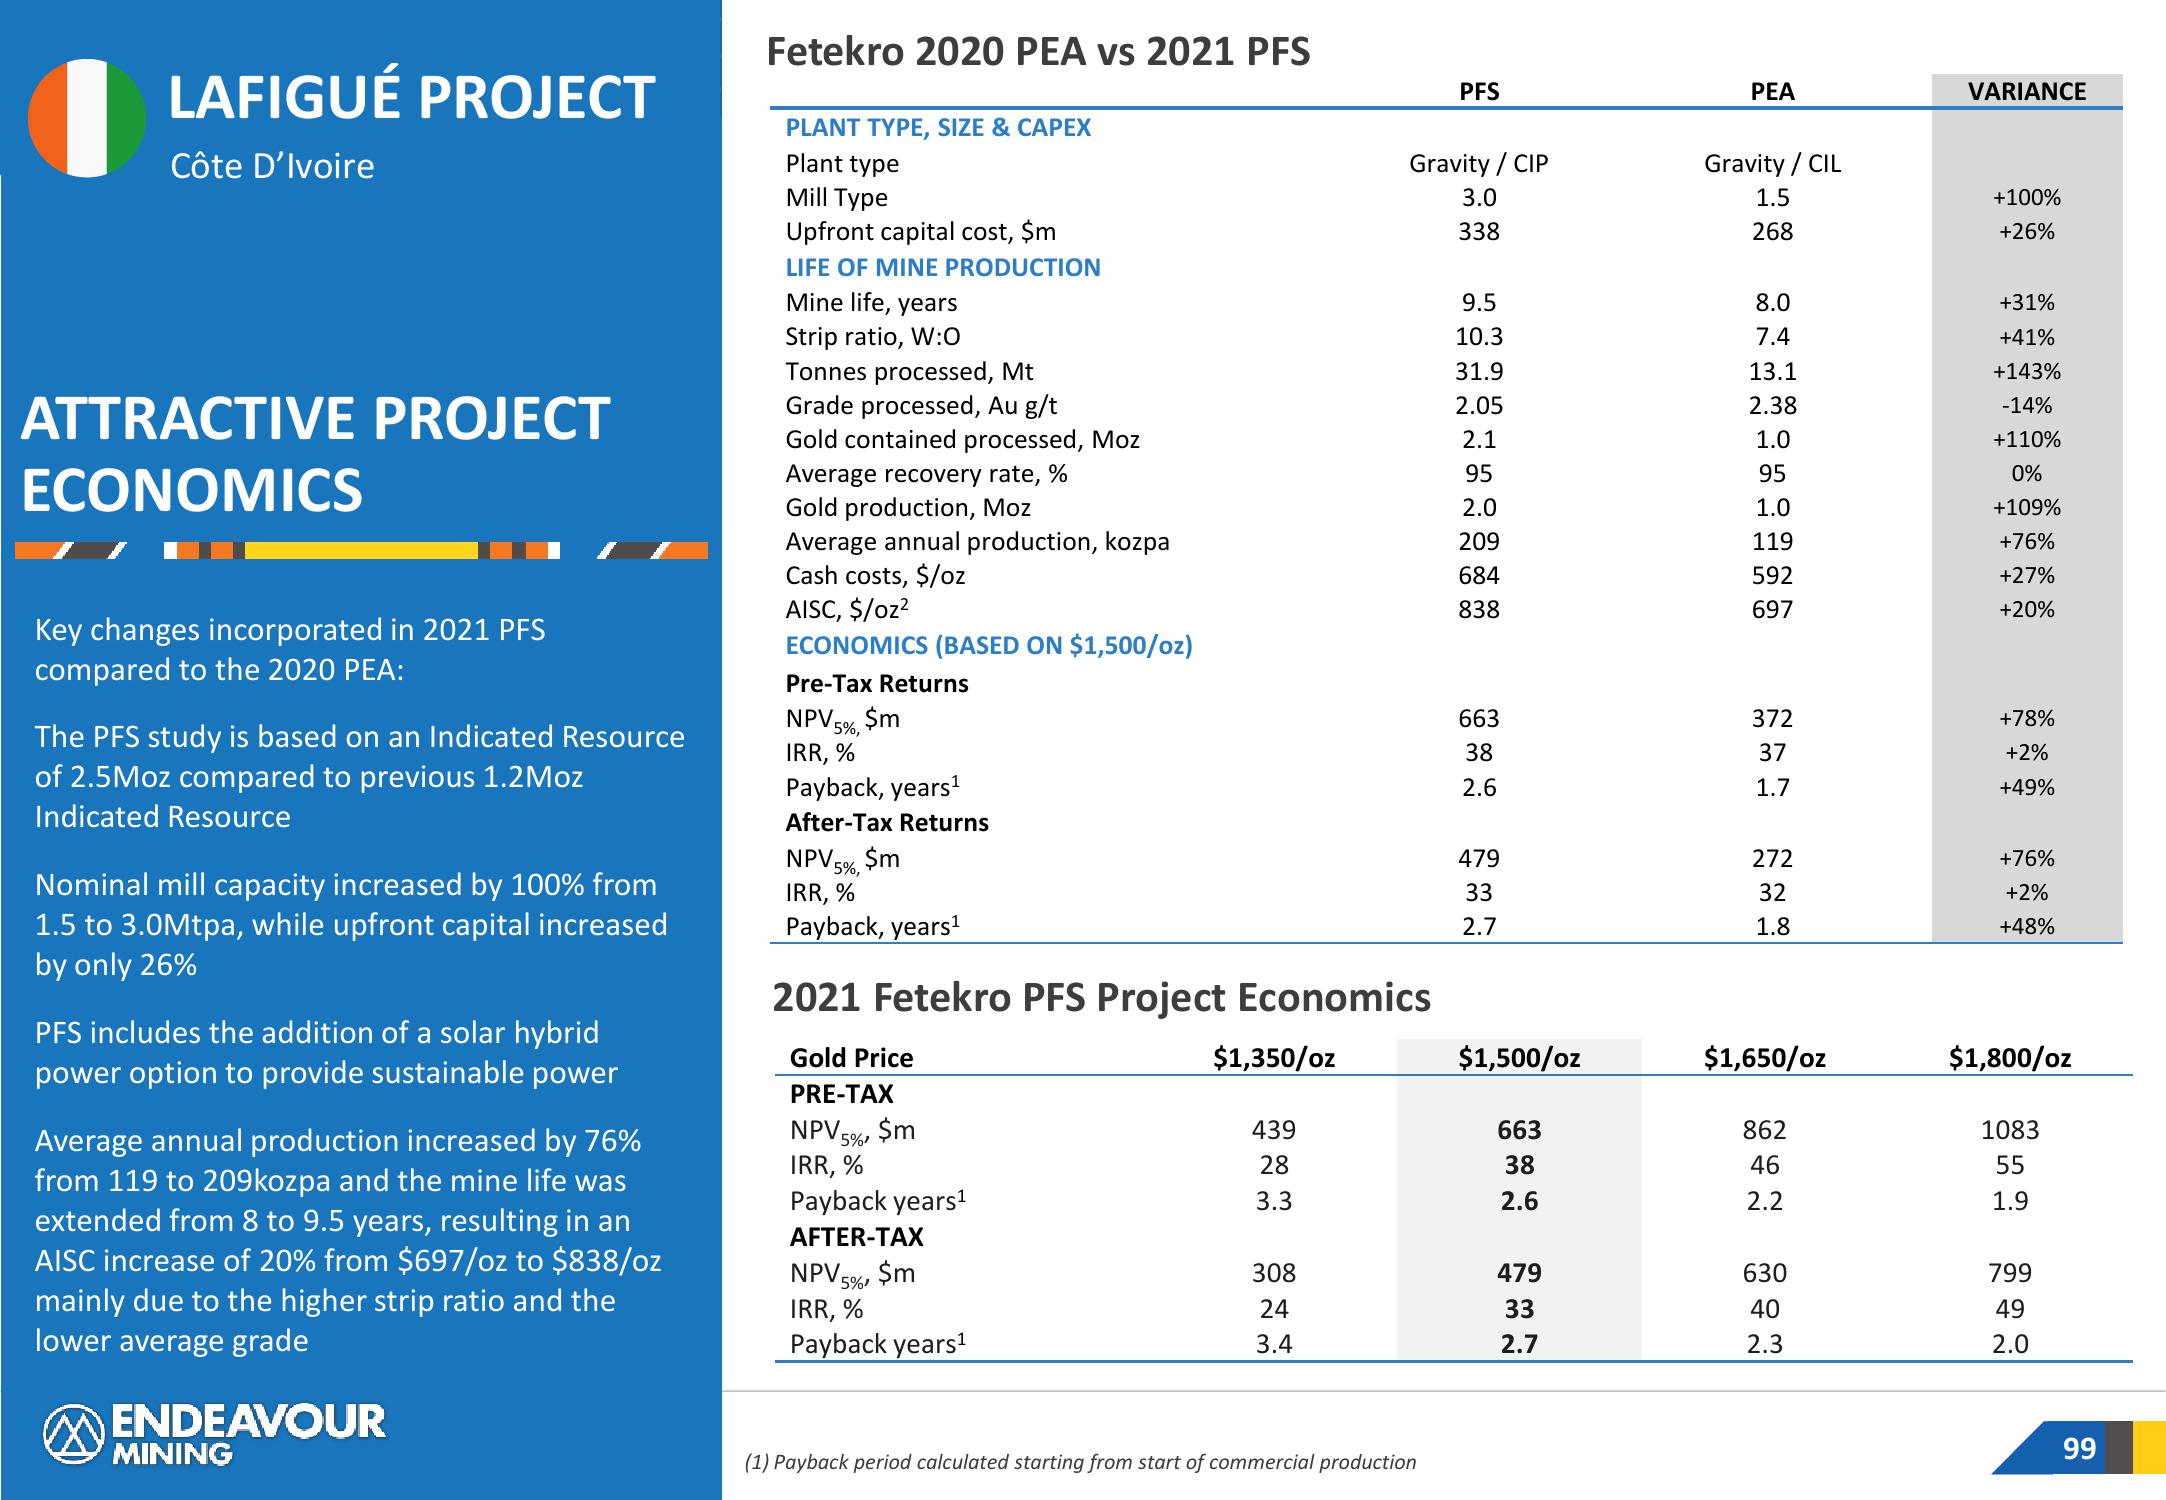
Key changes incorporated in 2021 PFS
compared to the 2020 PEA:
The PFS study is based on an Indicated Resource
of 2.5Moz compared to previous 1.2 Moz
Indicated Resource
Nominal mill capacity increased by 100% from
1.5 to 3.0Mtpa, while upfront capital increased
by only 26%
PFS includes the addition of a solar hybrid
power option to provide sustainable power
Average annual production increased by 76%
from 119 to 209kozpa and the mine life was
extended from 8 to 9.5 years, resulting in an
AISC increase of 20% from $697/oz to $838/oz
mainly due to the higher strip ratio and the
lower average grade
ENDEAVOUR
MINING
Fetekro 2020 PEA vs 2021 PFS
PLANT TYPE, SIZE & CAPEX
Plant type
Mill Type
Upfront capital cost, $m
LIFE OF MINE PRODUCTION
Mine life, years
Strip ratio, W:0
Tonnes processed, Mt
Grade processed, Au g/t
Gold contained processed, Moz
Average recovery rate, %
Gold production, Moz
Average annual production, kozpa
Cash costs, $/oz
AISC, $/oz²
ECONOMICS (BASED ON $1,500/oz)
Pre-Tax Returns
NPV 5%,
IRR, %
$m
Payback, years¹
After-Tax Returns
NPV 5%, $m
IRR, %
Payback, years¹
2021 Fetekro PFS Project Economics
Gold Price
PRE-TAX
NPV5%, $m
IRR, %
Payback years¹
AFTER-TAX
NPV5%, $m
IRR, %
Payback years¹
$1,350/oz
439
28
3.3
308
24
3.4
Gravity / CIP
3.0
338
PFS
(1) Payback period calculated starting from start of commercial production
9.5
10.3
31.9
2.05
2.1
95
2.0
209
684
838
663
38
2.6
479
33
2.7
$1,500/oz
663
38
2.6
479
33
2.7
PEA
Gravity / CIL
1.5
268
8.0
7.4
13.1
2.38
1.0
95
1.0
119
592
697
372
37
1.7
272
32
1.8
$1,650/oz
862
46
2.2
630
40
2.3
VARIANCE
+100%
+26%
+31%
+41%
+143%
-14%
+110%
0%
+109%
+76%
+27%
+20%
+78%
+2%
+49%
+76%
+2%
+48%
$1,800/oz
1083
55
1.9
799
49
2.0
99View entire presentation