Evercore Investment Banking Pitch Book
Valuation Perspectives
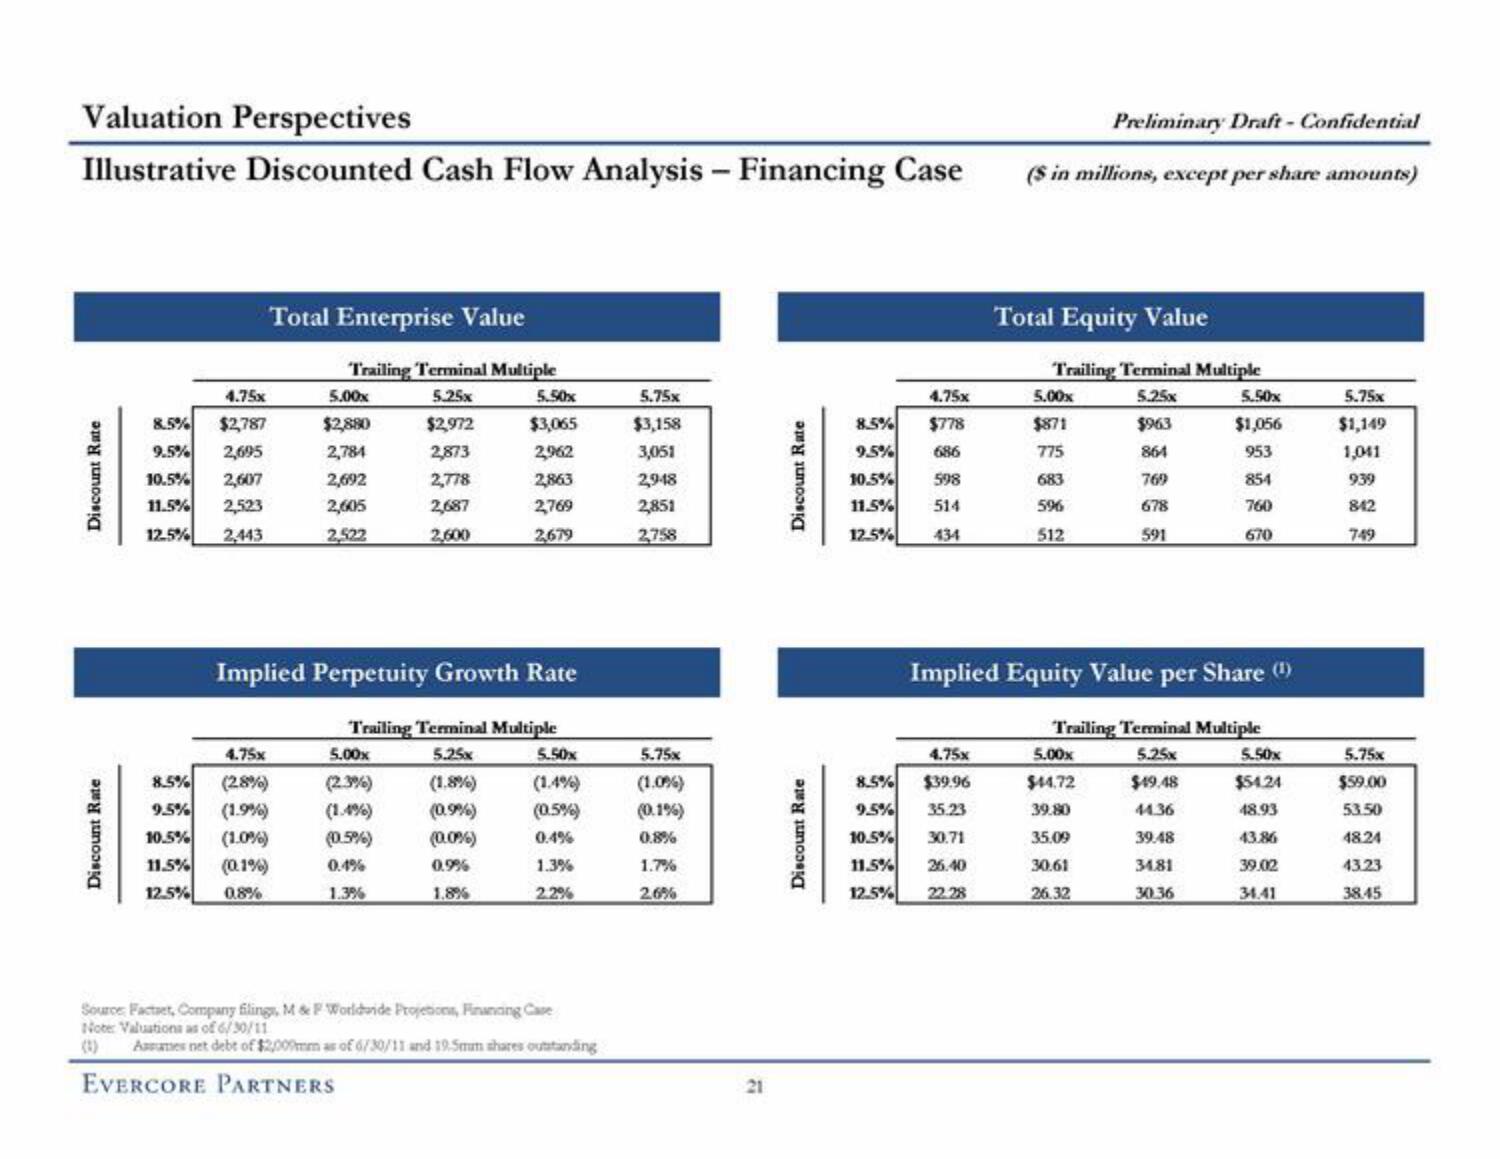
Illustrative Discounted Cash Flow Analysis - Financing Case
Discount Rate
Discount Rate
4.75x
8.5% $2,787
9.5% 2,695
10.5% 2,607
11.5% 2,523
12.5% 2,443
Total Enterprise Value
4.75x
8.5% (2.8%)
9.5% (1.9%)
10.5%
(1.0%)
11.5%
(0.1%)
12.5%
0.8%
Trailing Terminal Multiple
5.25x
5.00x
$2,880
2,784
2,692
2,605
2,522
$2,972
2,873
2,778
2,687
2,600
Implied Perpetuity Growth Rate
5.00x
(2.3%)
(1.4%)
(0.5%)
0.4%
1.3%
EVERCORE PARTNERS
5.50x
$3,065
2,962
2,863
2,769
2,679
Trailing Terminal Multiple
5.25x
(1.8%)
(0.9%)
(0,0%)
0.9%
1,89%
5.50x
(1.4%)
(0.5%)
0.4%
1.3%
2.2%
Source: Factaet, Company filings, M & F Worldwide Projetions, Financing Case
Note Valuations as of 6/30/11
Assumes net debt of $2,009mm as of 6/30/11 and 19.5mm shares outstanding
5.75x
$3,158
3,051
2,948
2,851
2,758
5.75x
(1.0%)
(0.1%)
0.8%
1.7%
2.6%
21
Discount Rate
Discount Rate
8.5%
9.5%
10.5%
11.5%
12.5%
4.75x
$778
686
598
514
434
Preliminary Draft - Confidential
($ in millions, except per share amounts)
4.75x
8.5% $39.96
9.5% 35.23
10.5%
30.71
11.5%
26.40
12.5% 22.28
Total Equity Value
Trailing Terminal Multiple
5.25x
5.00x
$871
775
683
596
512
$963
864
769
678
591
Implied Equity Value per Share (¹)
5.00x
$44.72
39.80
35.09
30.61
26.32
5.50x
$1,056
953
854
760
670
Trailing Terminal Multiple
5.25x
$49.48
44.36
39.48
34.81
30.36
5.50x
$54.24
48.93
43.86
39.02
34.41
5.75x
$1,149
1,041
939
842
749
5.75x
$59.00
53.50
48.24
43.23
38.45View entire presentation