Moelis & Company Investment Banking Pitch Book
Discounted Cash Flow Analysis
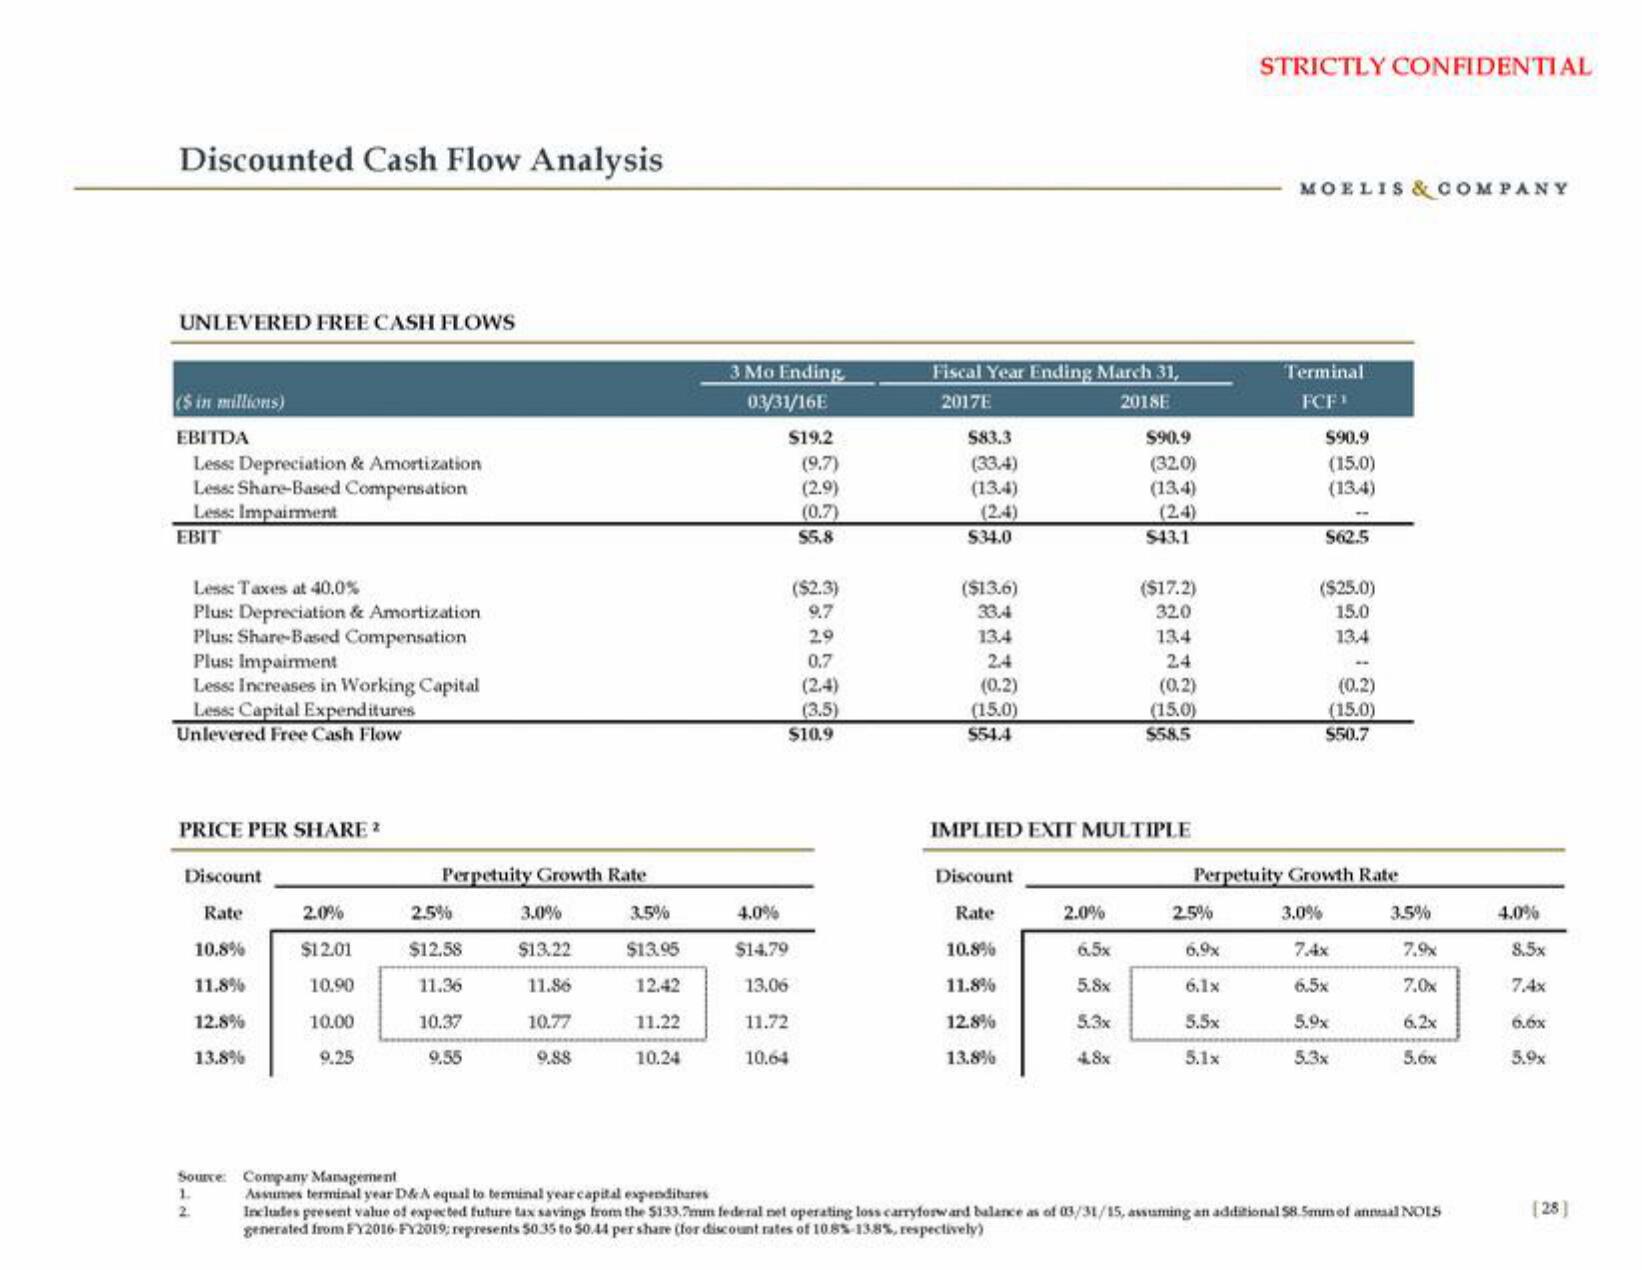
UNLEVERED FREE CASH FLOWS
($ in millions)
EBITDA
Less: Depreciation & Amortization
Less: Share-Based Compensation
Less: Impairment
EBIT
Less: Taxes at 40.0%
Plus: Depreciation & Amortization
Plus: Share-Based Compensation
Plus: Impairment
Less: Increases in Working Capital
Less: Capital Expenditures
Unlevered Free Cash Flow
PRICE PER SHARE 2
Discount
Rate
10.8%
11.8%
12.8%
13.8%
1.
2.
2.0%
$12.01
10.90
10.00
9.25
Source: Company Management
Perpetuity Growth Rate
2.5%
$12.58
11.36
10.37
9.55
3.0%
$13.22
11.86
10.77
9.88
3.5%
$13.95
12.42
11.22
10.24
Assumes terminal year D&A equal to terminal year capital expenditures
3 Mo Ending
03/31/16E
$19.2
(9.7)
(2.9)
(0.7)
$5.8
4.0%
$14.79
13.06
11.72
10.64
($2.3)
9.7
29
0.7
(2.4)
(3.5)
$10.9
Fiscal Year Ending March 31,
2017E
2018E
583.3
(33.4)
(134)
(2.4)
$34.0
($13.6)
33.4
13.4
2.4
(0.2)
(15.0)
$54.4
Discount
Rate
10.8%
11.8%
12.8%
13.8%
2.0%
$90.9
(32.0)
(134)
(24)
IMPLIED EXIT MULTIPLE
6.5x
5.8x
5.3x
4.8x
$43.1
($17.2)
320
13.4
2.4
(0.2)
(15.0)
$58,5
2.5%
STRICTLY CONFIDENTIAL
6.9x
6.1x
5.5x
5.1x
MOELIS & COMPANY
Terminal
FCF¹
$90.9
(15.0)
(13.4)
$62.5
($25.0)
15.0
13.4
Perpetuity Growth Rate
3.0%
(0.2)
(15.0)
$50.7
7.4x
6.5x
5.9x
5.3x
3.5%
7.9x
7.0x
6.2x
5.6x
Includes present value of expected future tax savings from the $133.7mm federal net operating loss carryforward balance as of 03/31/15, assuming an additional 58.5mm of annual NOIS
generated from FY2016-FY2019; represents 50.35 to 50.44 per share (for discount rates of 10.8%-13.8%, respectively)
4.0%
8.5x
6.6x
5.9x
(28)View entire presentation