Zegna SPAC Presentation Deck
4. Key financials overview
ZEGNA GROUP
KEY FINANCIALS
including Thom Browne 12.
months contribution¹
2018A
+11%
1,306
1,271
1-1
11,1731
il
Ermenegildo Zegna Group
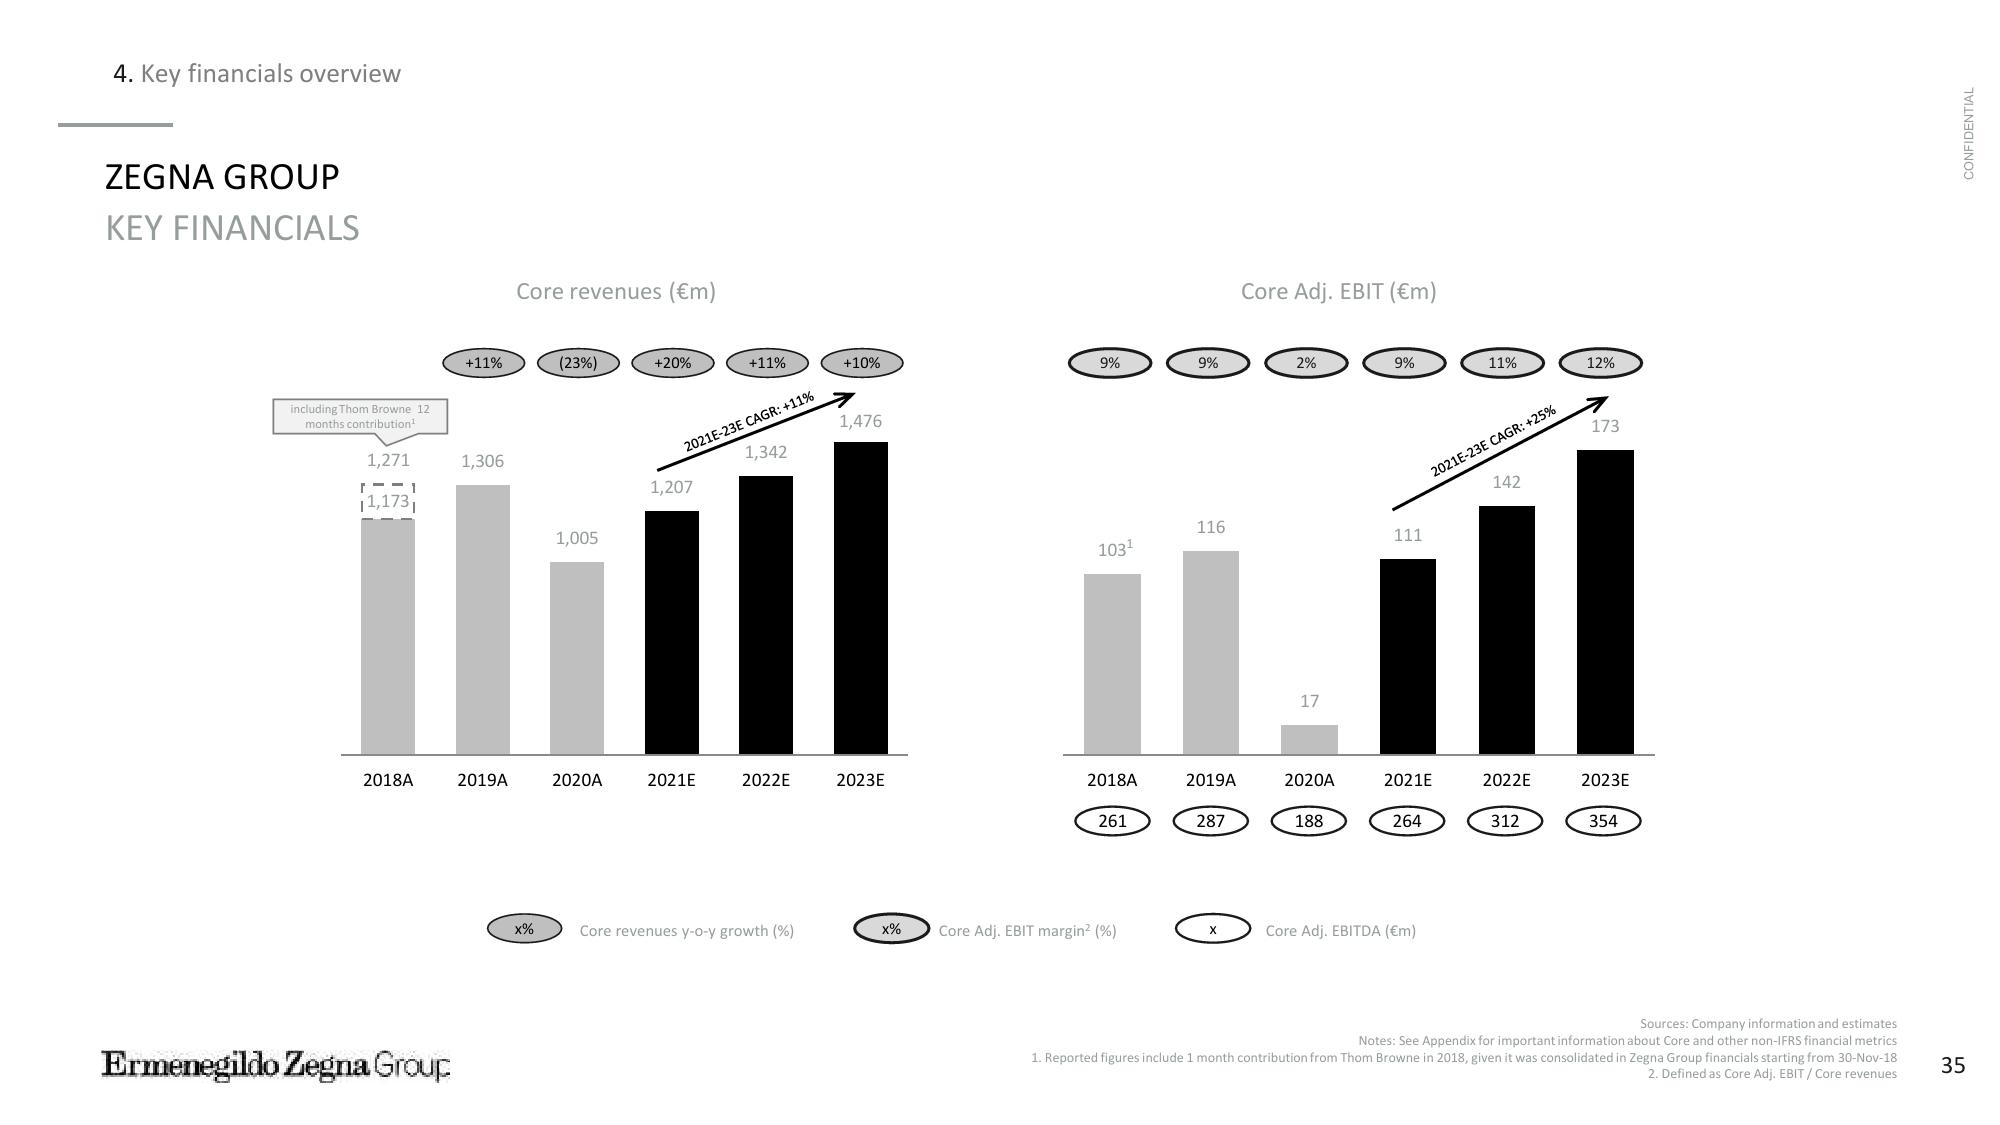
Core revenues (€m)
2019A
(23%)
1,005
2020A
+20%
2021E-23E CAGR: +11%
1,207
+11%
2021E
1,342
2022E
x% Core revenues y-o-y growth (%)
+10%
1,476
2023E
x%
9%
103¹
2018A
261
Core Adj. EBIT margin² (%)
9%
116
2019A
287
Core Adj. EBIT (€m)
2%
17
2020A
188
9%
111
2021E
264
Core Adj. EBITDA (€m)
11%
2021E-23E CAGR: +25%
142
2022E
312
12%
7
173
2023E
354
Sources: Company information and estimates
Notes: See Appendix for important information about Core and other non-IFRS financial metrics
1. Reported figures include 1 month contribution from Thom Browne in 2018, given it was consolidated in Zegna Group financials starting from 30-Nov-18
2. Defined as Core Adj. EBIT/ Core revenues
CONFIDENTIAL
35View entire presentation