Lumen Results Presentation Deck
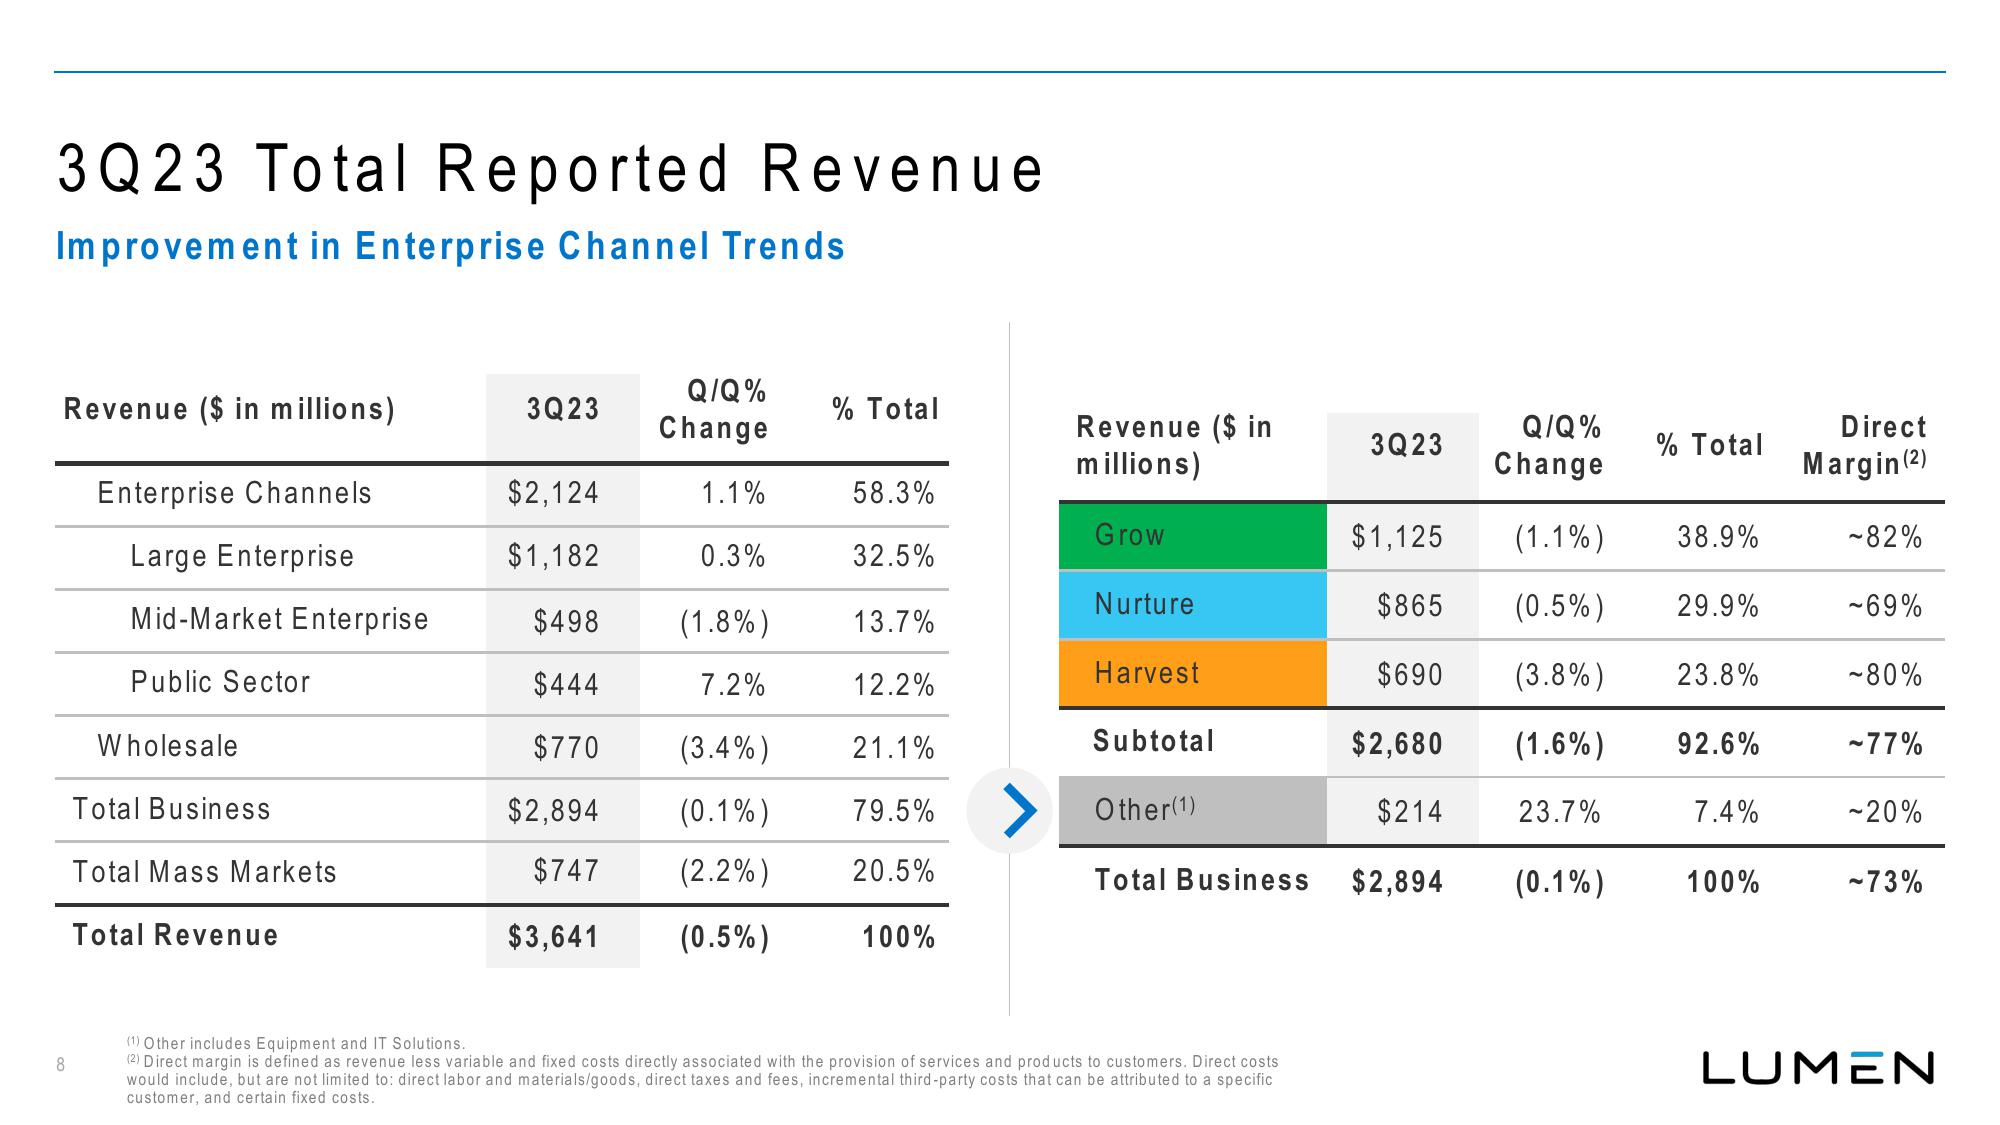
3Q23 Total Reported Revenue
Improvement in Enterprise Channel Trends.
Revenue ($ in millions)
8
Enterprise Channels
Large Enterprise
Mid-Market Enterprise
Public Sector
Wholesale
Total Business
Total Mass Markets
Total Revenue
3Q23
$2,124
$1,182
$498
$444
$770
$2,894
$747
$3,641
Q/Q%
Change
1.1%
0.3%
(1.8%)
7.2%
(3.4%)
(0.1%)
(2.2%)
(0.5%)
% Total
58.3%
32.5%
13.7%
12.2%
21.1%
79.5%
20.5%
100%
Revenue ($ in
millions)
Grow
Nurture
Harvest
Subtotal
Other (1)
Total Business
(1) Other includes Equipment and IT Solutions.
(2) Direct margin is defined as revenue less variable and fixed costs directly associated with the provision of services and products to customers. Direct costs
would include, but are not limited to: direct labor and materials/goods, direct taxes and fees, incremental third-party costs that can be attributed to a specific
customer, and certain fixed costs.
3Q23
Q/Q%
Change
% Total
$1,125
(1.1%)
38.9%
$865 (0.5%) 29.9%
(3.8%)
$690
$2,680
(1.6%) 92.6%
$214
23.7%
$2,894
23.8%
7.4%
(0.1%) 100%
Direct
Margin (2)
~82%
-69%
-80%
-77%
-20%
-73%
LUMENView entire presentation