Shift SPAC Presentation Deck
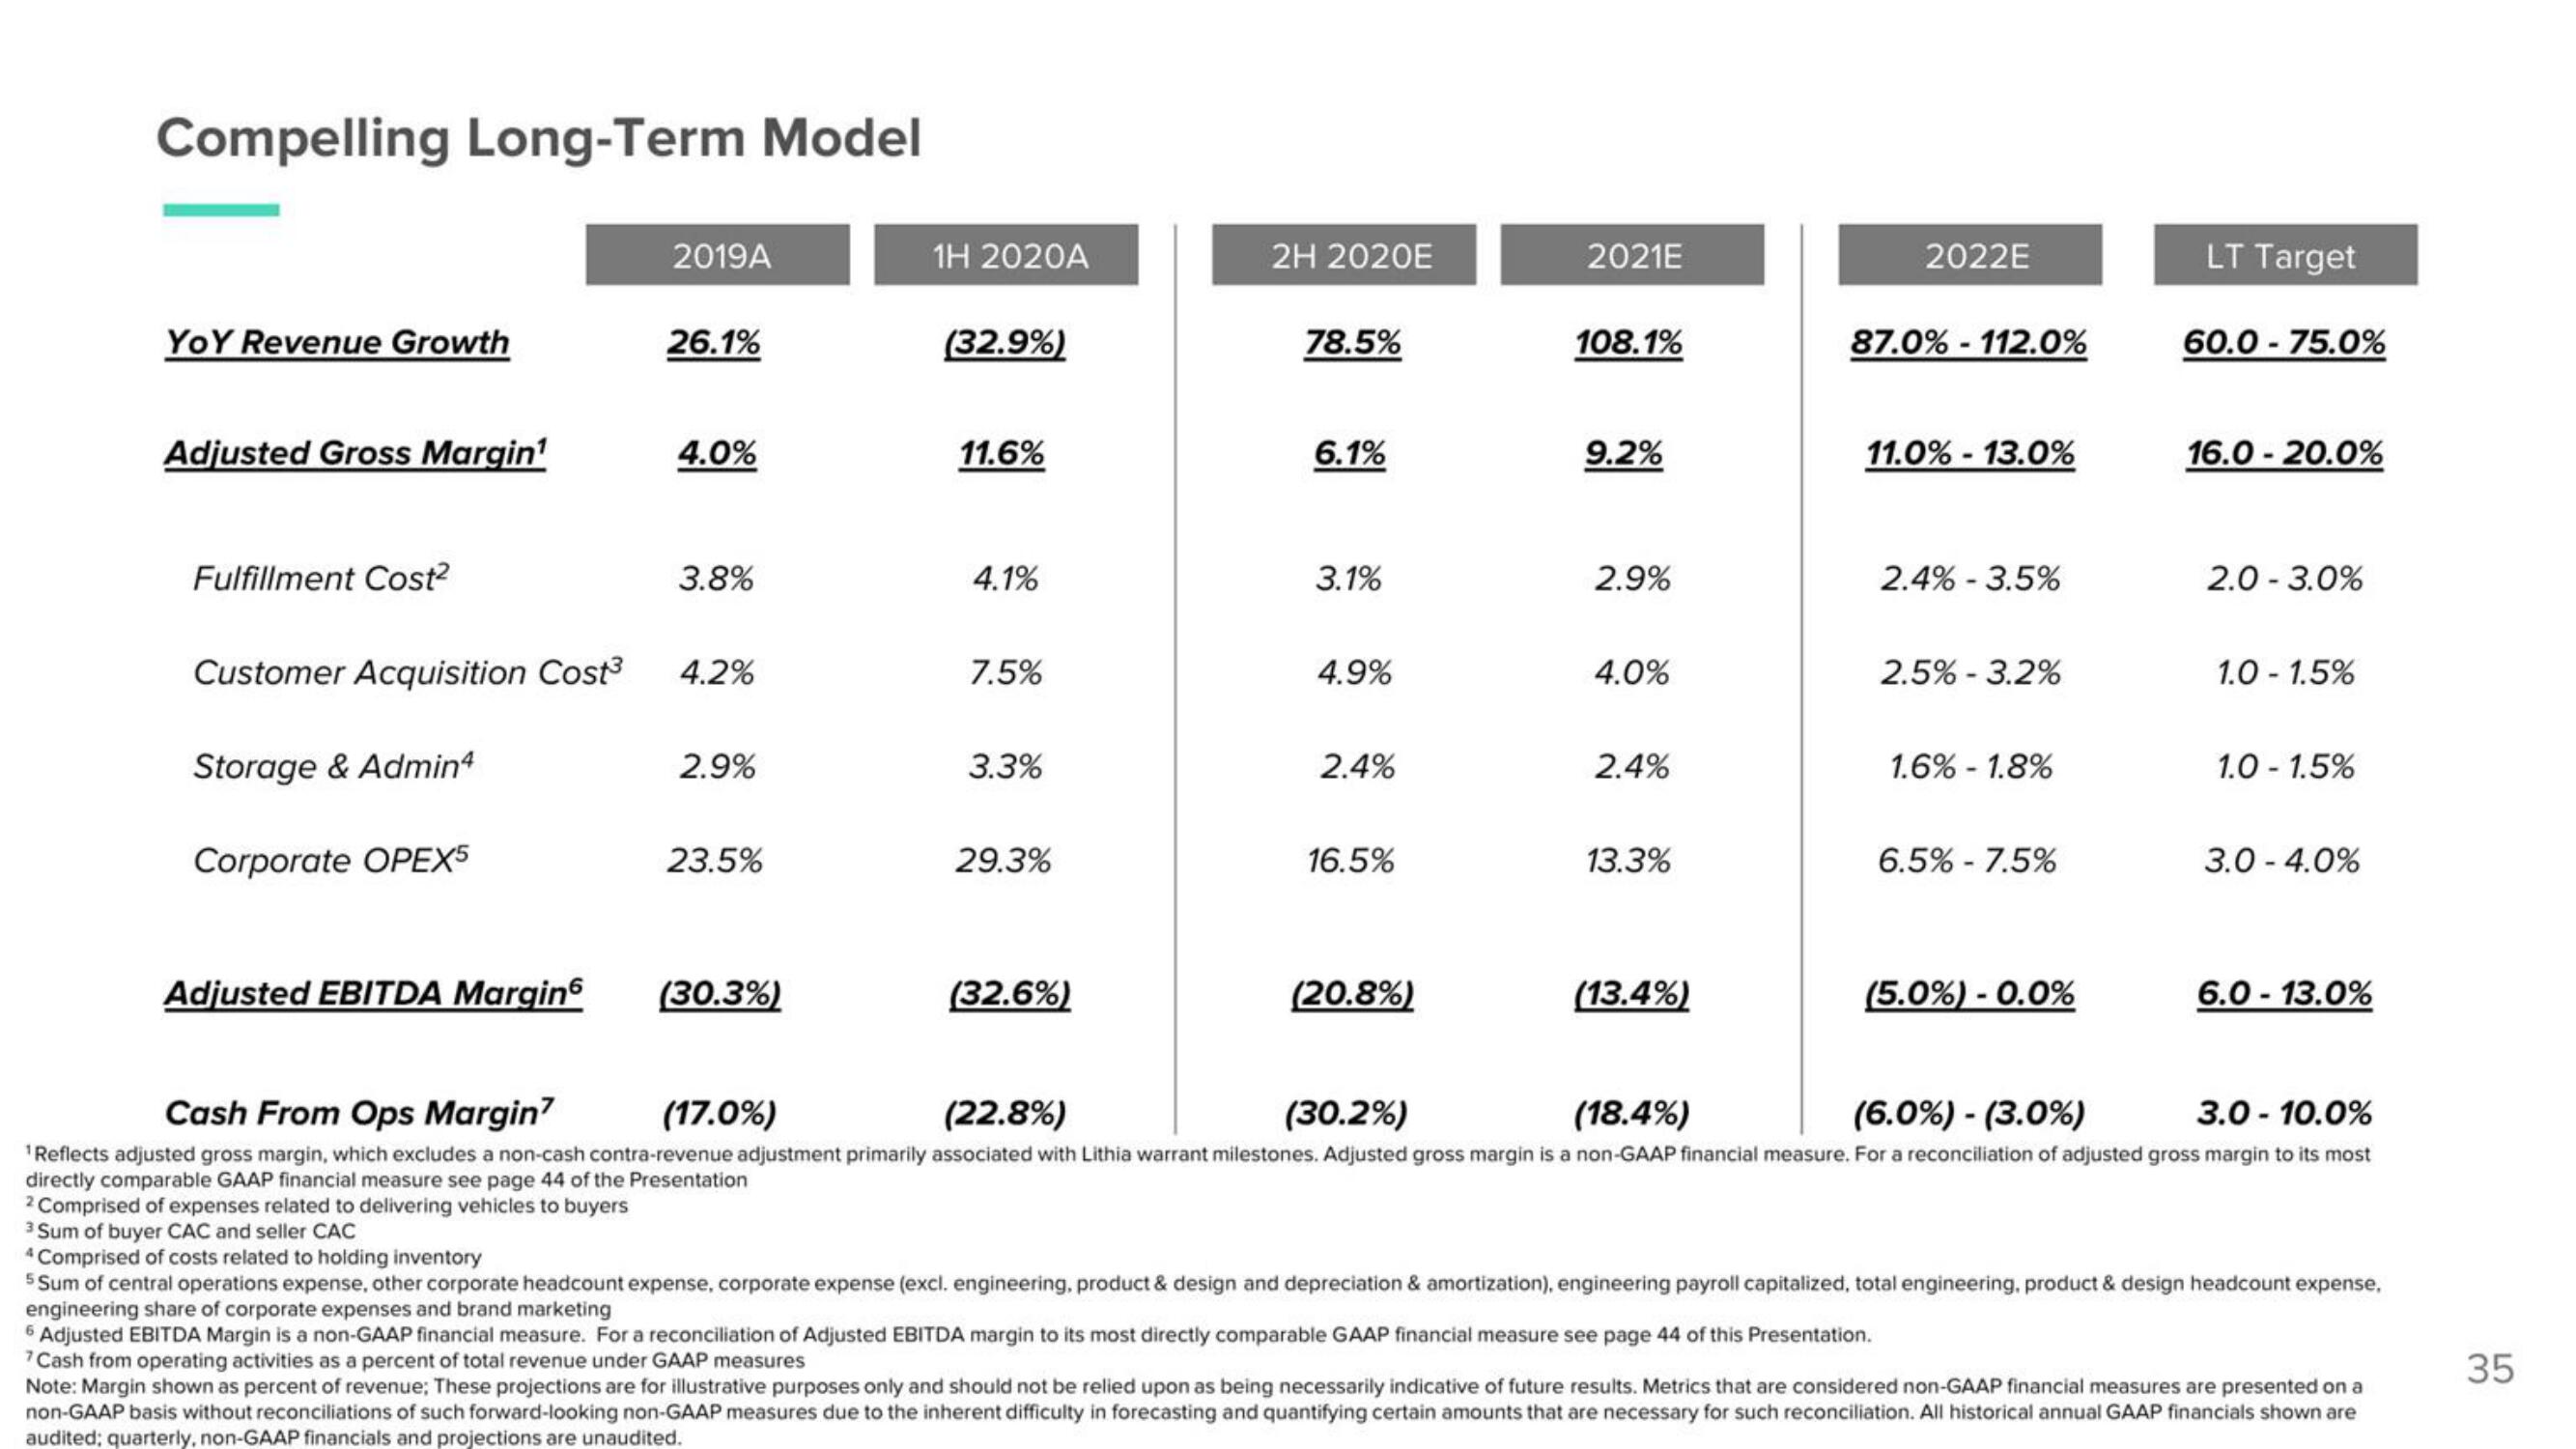
Compelling Long-Term Model
YOY Revenue Growth
Adjusted Gross Margin¹
Fulfillment Cost²
Storage & Admin4
Corporate OPEX5
2019A
Adjusted EBITDA Margin
26.1%
Customer Acquisition Cost³ 4.2%
4.0%
3.8%
2.9%
23.5%
(30.3%)
1H 2020A
(32.9%)
11.6%
4.1%
7.5%
3.3%
29.3%
(32.6%)
2H 2020E
78.5%
6.1%
3.1%
4.9%
2.4%
16.5%
(20.8%)
2021E
108.1%
9.2%
2.9%
4.0%
2.4%
13.3%
(13.4%)
2022E
87.0% - 112.0%
11.0% - 13.0%
2.4% -3.5%
2.5% - 3.2%
1.6% - 1.8%
6.5% -7.5%
(5.0%) - 0.0%
LT Target
60.0-75.0%
16.0-20.0%
2.0 - 3.0%
1.0-1.5%
1.0-1.5%
3.0-4.0%
6.0-13.0%
(17.0%)
(22.8%)
(30.2%)
(18.4%)
(6.0%) - (3.0%)
3.0 - 10.0%
Cash From Ops Margin7
¹Reflects adjusted gross margin, which excludes a non-cash contra-revenue adjustment primarily associated with Lithia warrant milestones. Adjusted gross margin is a non-GAAP financial measure. For a reconciliation of adjusted gross margin to its most
directly comparable GAAP financial measure see page 44 of the Presentation
2 Comprised of expenses related to delivering vehicles to buyers
3 Sum of buyer CAC and seller CAC
4 Comprised of costs related to holding inventory
5 Sum of central operations expense, other corporate headcount expense, corporate expense (excl. engineering, product & design and depreciation & amortization), engineering payroll capitalized, total engineering, product & design headcount expense,
engineering share of corporate expenses and brand marketing
6 Adjusted EBITDA Margin is a non-GAAP financial measure. For a reconciliation of Adjusted EBITDA margin to its most directly comparable GAAP financial measure see page 44 of this Presentation.
7 Cash from operating activities as a percent of total revenue under GAAP measures
Note: Margin shown as percent of revenue; These projections are for illustrative purposes only and should not be relied upon as being necessarily indicative of future results. Metrics that are considered non-GAAP financial measures are presented on a
non-GAAP basis without reconciliations of such forward-looking non-GAAP measures due to the inherent difficulty in forecasting and quantifying certain amounts that are necessary for such reconciliation. All historical annual GAAP financials shown are
audited; quarterly, non-GAAP financials and projections are unaudited.
35View entire presentation