3Q20 Earnings Call Presentation
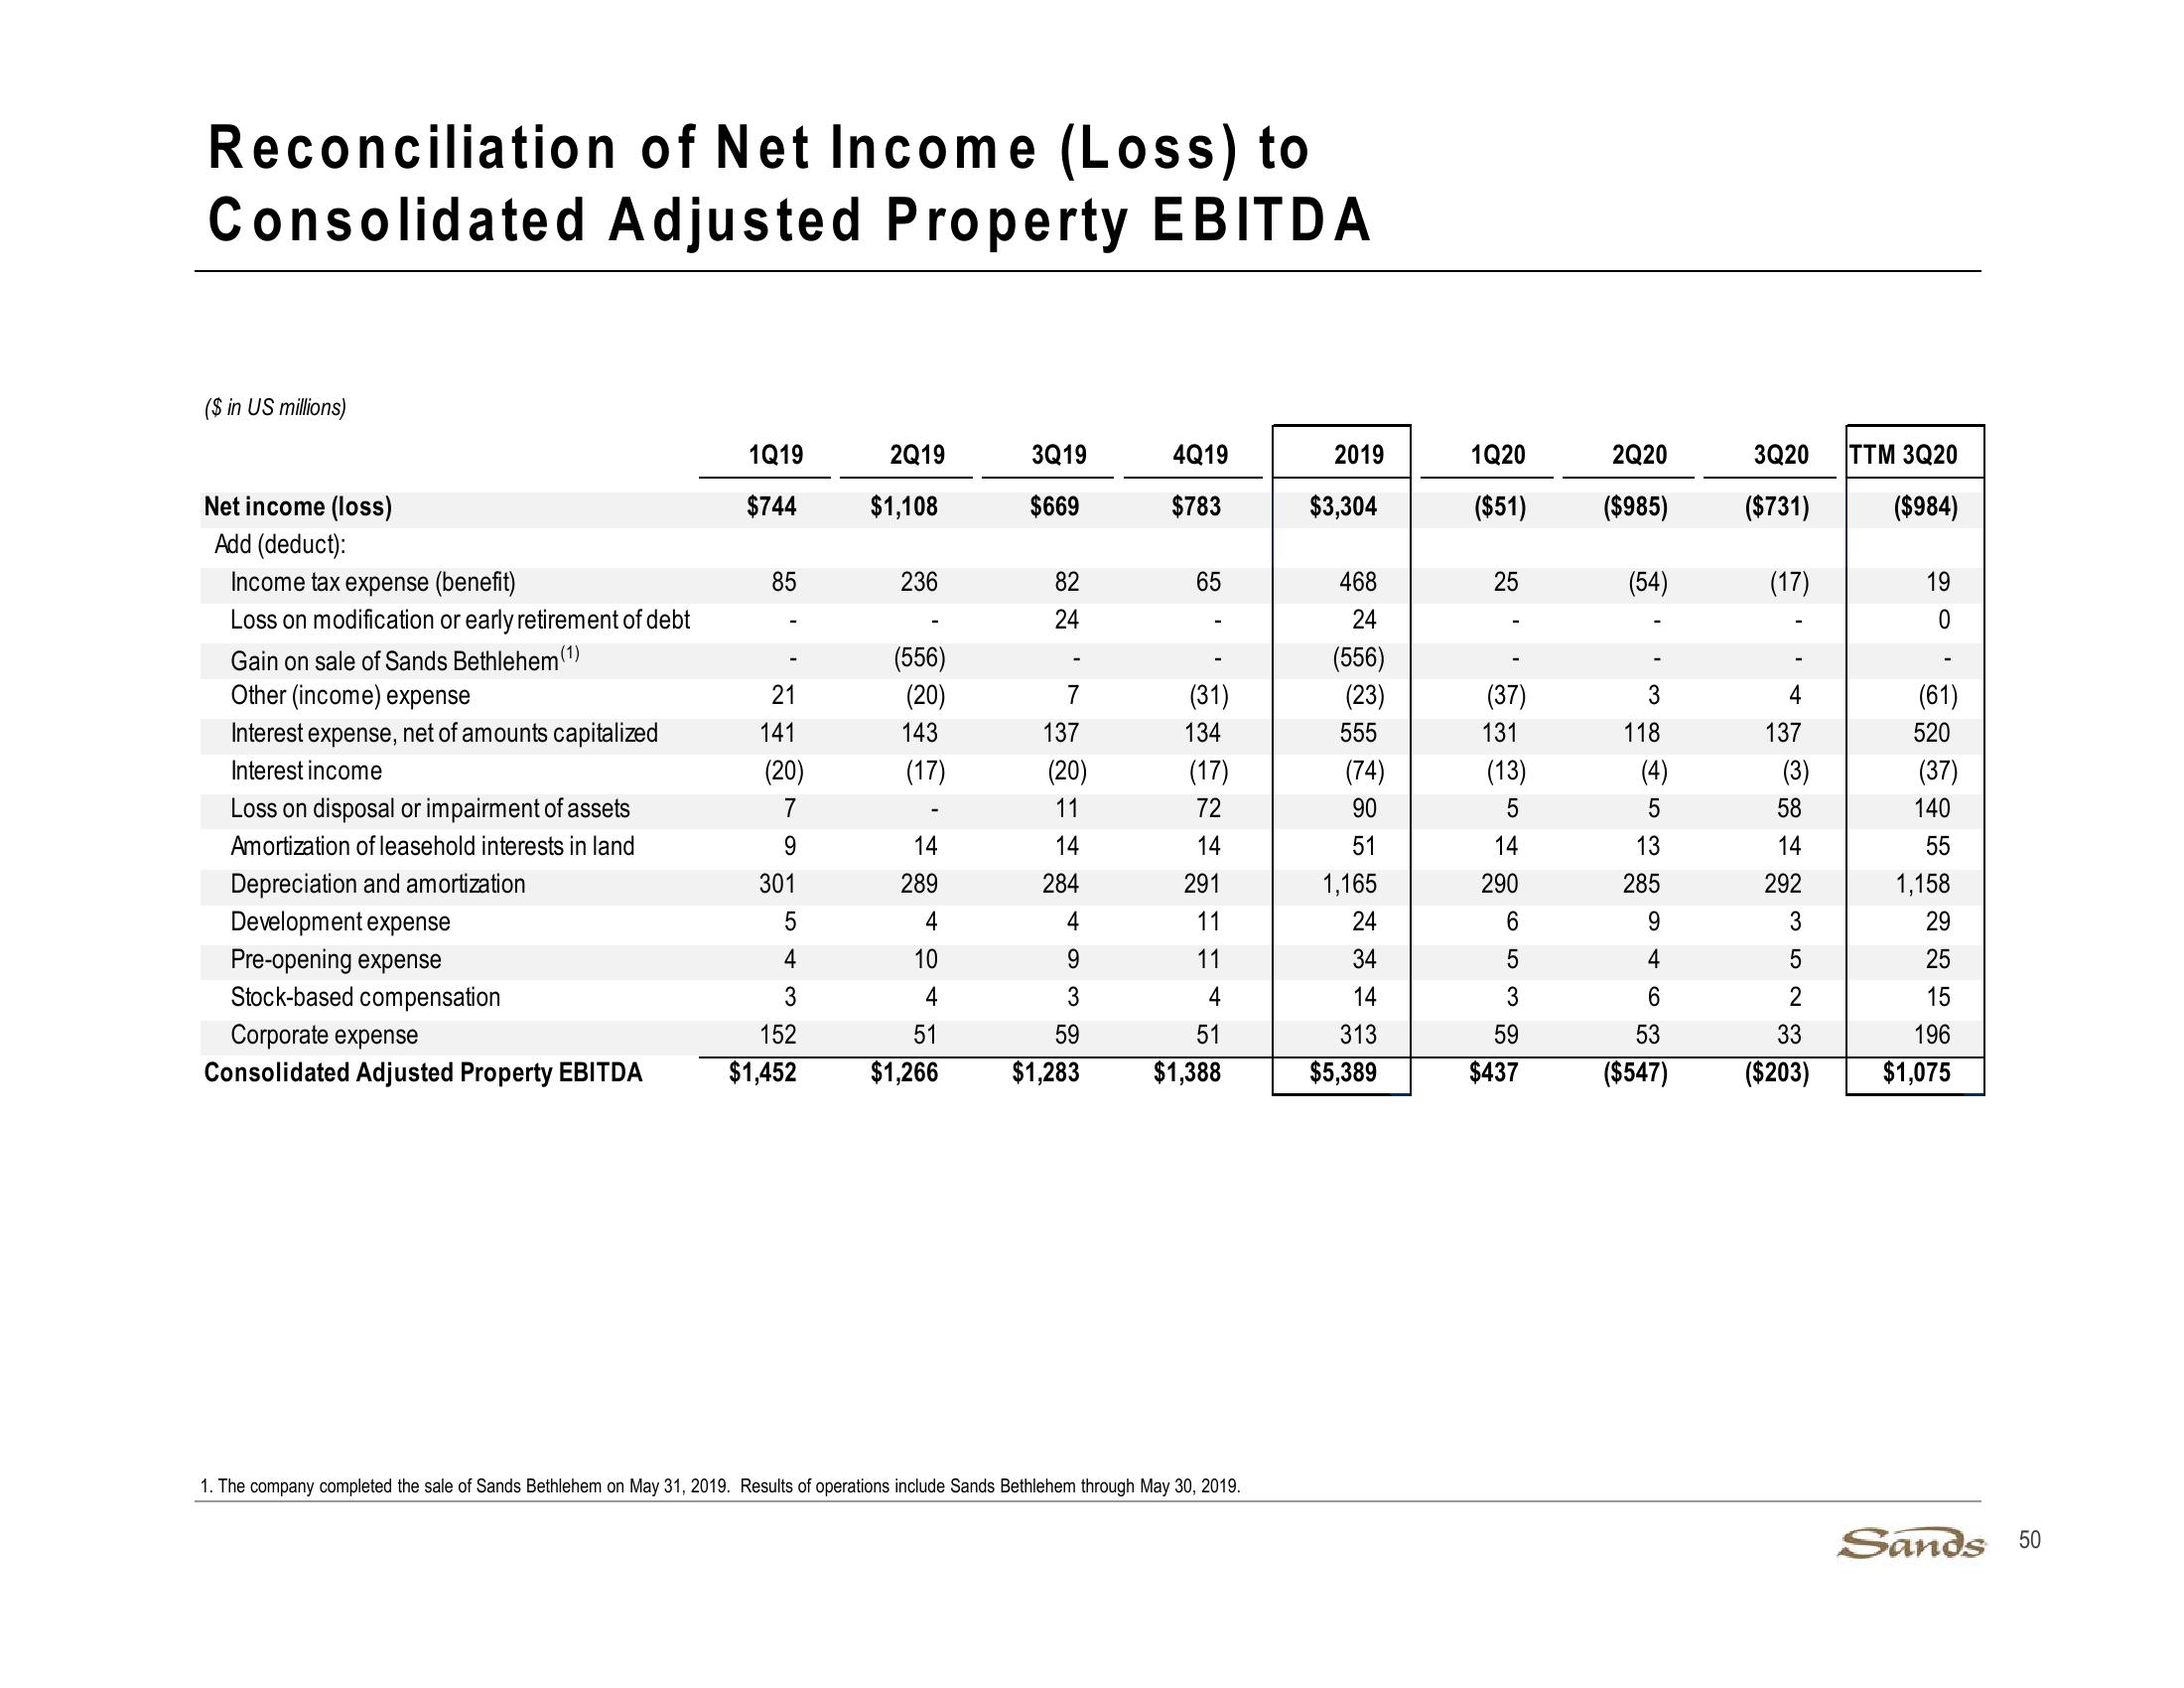
Reconciliation of Net Income (Loss) to
Consolidated Adjusted Property EBITDA
($ in US millions)
Net income (loss)
Add (deduct):
Income tax expense (benefit)
85
236
82
65
Loss on modification or early retirement of debt
24
1Q19
2Q19
3Q19
4Q19
2019
1Q20
2Q20
3Q20
TTM 3Q20
$744
$1,108
$669
$783
$3,304
($51)
($985)
($731) ($984)
25
25
(54)
(17)
19
0
468
24
Gain on sale of Sands Bethlehem
(556)
(556)
Other (income) expense
21
(20)
7
(31)
(23)
Interest expense, net of amounts capitalized
141
143
137
134
555
131
Interest income
(20)
(17)
(20)
(17)
(74)
Loss on disposal or impairment of assets
7
11
72
90
ིཥྱོཡ
(37)
3
4
(61)
118
137
520
(13)
(4)
D
(3)
(37)
5
58
140
Amortization of leasehold interests in land
9
14
14
14
51
14
13
14
55
Depreciation and amortization
301
289
284
291
1,165
290
285
292
1,158
Development expense
Pre-opening expense
Stock-based compensation
Corporate expense
Consolidated Adjusted Property EBITDA
152
$1,452
5435
4
4
11
24
10
9
11
34
4
3
4
14
51
59
51
313
59
6530
53
523
9460
3
29
25
15
196
$1,266
$1,283
$1,388
$5,389
$437
($547)
($203)
$1,075
1. The company completed the sale of Sands Bethlehem on May 31, 2019. Results of operations include Sands Bethlehem through May 30, 2019.
Sands 50View entire presentation