HBT Financial Results Presentation Deck
Company Snapshot
Overview
✓ Company incorporated in 1982 from base of family-owned banks
and completed its IPO in October 2019
✓ Headquartered in Bloomington, Illinois, with operations
throughout Illinois and Eastern lowa
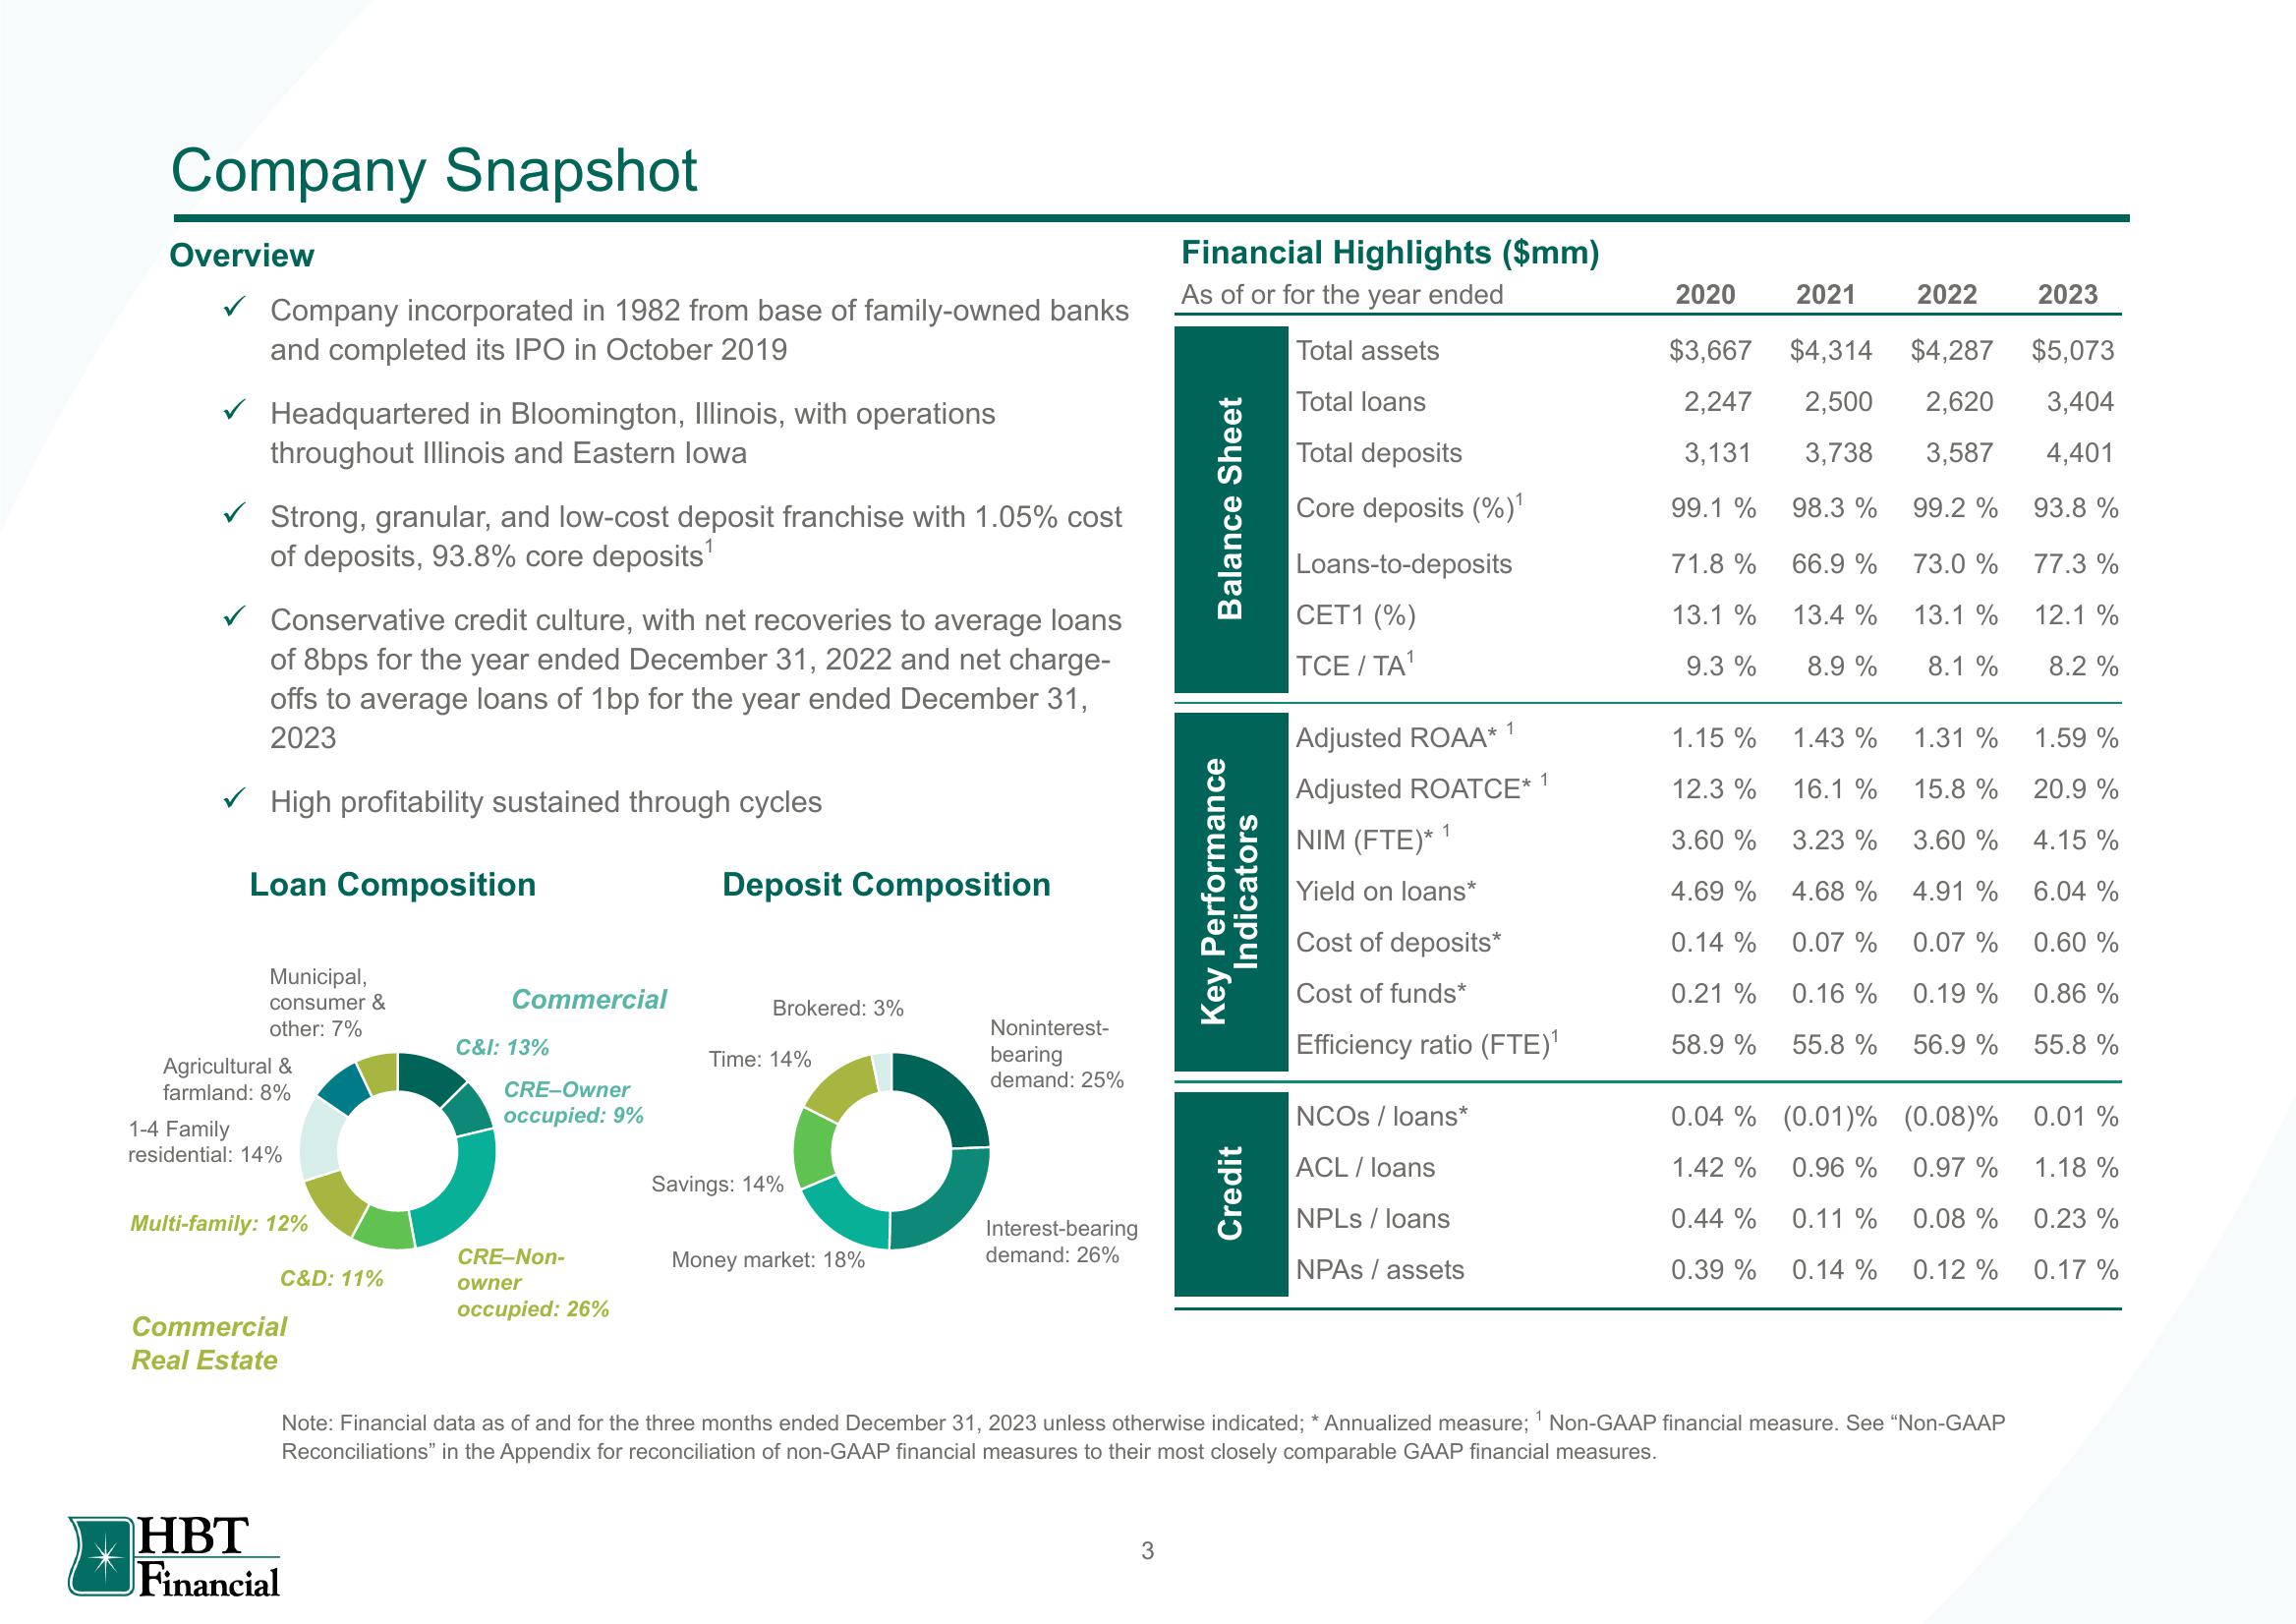
Strong, granular, and low-cost deposit franchise with 1.05% cost
of deposits, 93.8% core deposits¹
✓ Conservative credit culture, with net recoveries to average loans
of 8bps for the year ended December 31, 2022 and net charge-
offs to average loans of 1bp for the year ended December 31,
2023
✓ High profitability sustained through cycles
Loan Composition
Municipal,
consumer &
other: 7%
Agricultural &
farmland: 8%
1-4 Family
residential: 14%
Multi-family: 12%
C&D: 11%
Commercial
Real Estate
Commercial
HBT
Financial
C&I: 13%
CRE-Owner
occupied: 9%
CRE-Non-
owner
occupied: 26%
Deposit Composition
Brokered: 3%
Time: 14%
Savings: 14%
Noninterest-
bearing
demand: 25%
O
Money market: 18%
Interest-bearing
demand: 26%
Financial Highlights ($mm)
As of or for the year ended
3
Balance Sheet
Key Performance
Indicators
Credit
Total assets
Total loans
Total deposits
Core deposits (%) ¹
Loans-to-deposits
CET1 (%)
TCE / TA¹
Adjusted ROAA*
Adjusted ROATCE* 1
NIM (FTE)* 1
Yield on loans*
Cost of deposits*
Cost of funds*
Efficiency ratio (FTE)¹
1
NCOS / loans*
ACL / loans
NPLs / loans
NPAS/assets
1
2021
$3,667 $4,314 $4,287
2,247
3,131
99.1 %
2,500 2,620
3,738 3,587
98.3 % 99.2 %
73.0 %
13.1 %
8.1 %
71.8%
13.1 %
9.3 %
2020
1.15%
12.3 %
3.60 %
4.69 %
0.14%
0.21%
58.9 %
0.04%
1.42%
0.44 %
0.39 %
66.9%
13.4%
8.9 %
1.43%
16.1 %
3.23 %
4.68 %
0.07 %
0.16%
55.8 %
(0.01) %
0.96 %
0.11 %
0.14 %
2022
1.31 %
15.8 %
3.60 %
4.91 %
0.07 %
0.19 %
56.9 %
Note: Financial data as of and for the three months ended December 31, 2023 unless otherwise indicated; * Annualized measure; Non-GAAP financial measure. See "Non-GAAP
Reconciliations" in the Appendix for reconciliation of non-GAAP financial measures to their most closely comparable GAAP financial measures.
(0.08) %
0.97 %
0.08 %
0.12 %
2023
$5,073
3,404
4,401
93.8 %
77.3 %
12.1 %
8.2 %
1.59%
20.9 %
4.15 %
6.04 %
0.60%
0.86 %
55.8%
0.01%
1.18 %
0.23%
0.17%View entire presentation