Global Beverage Trade and Company Overviews
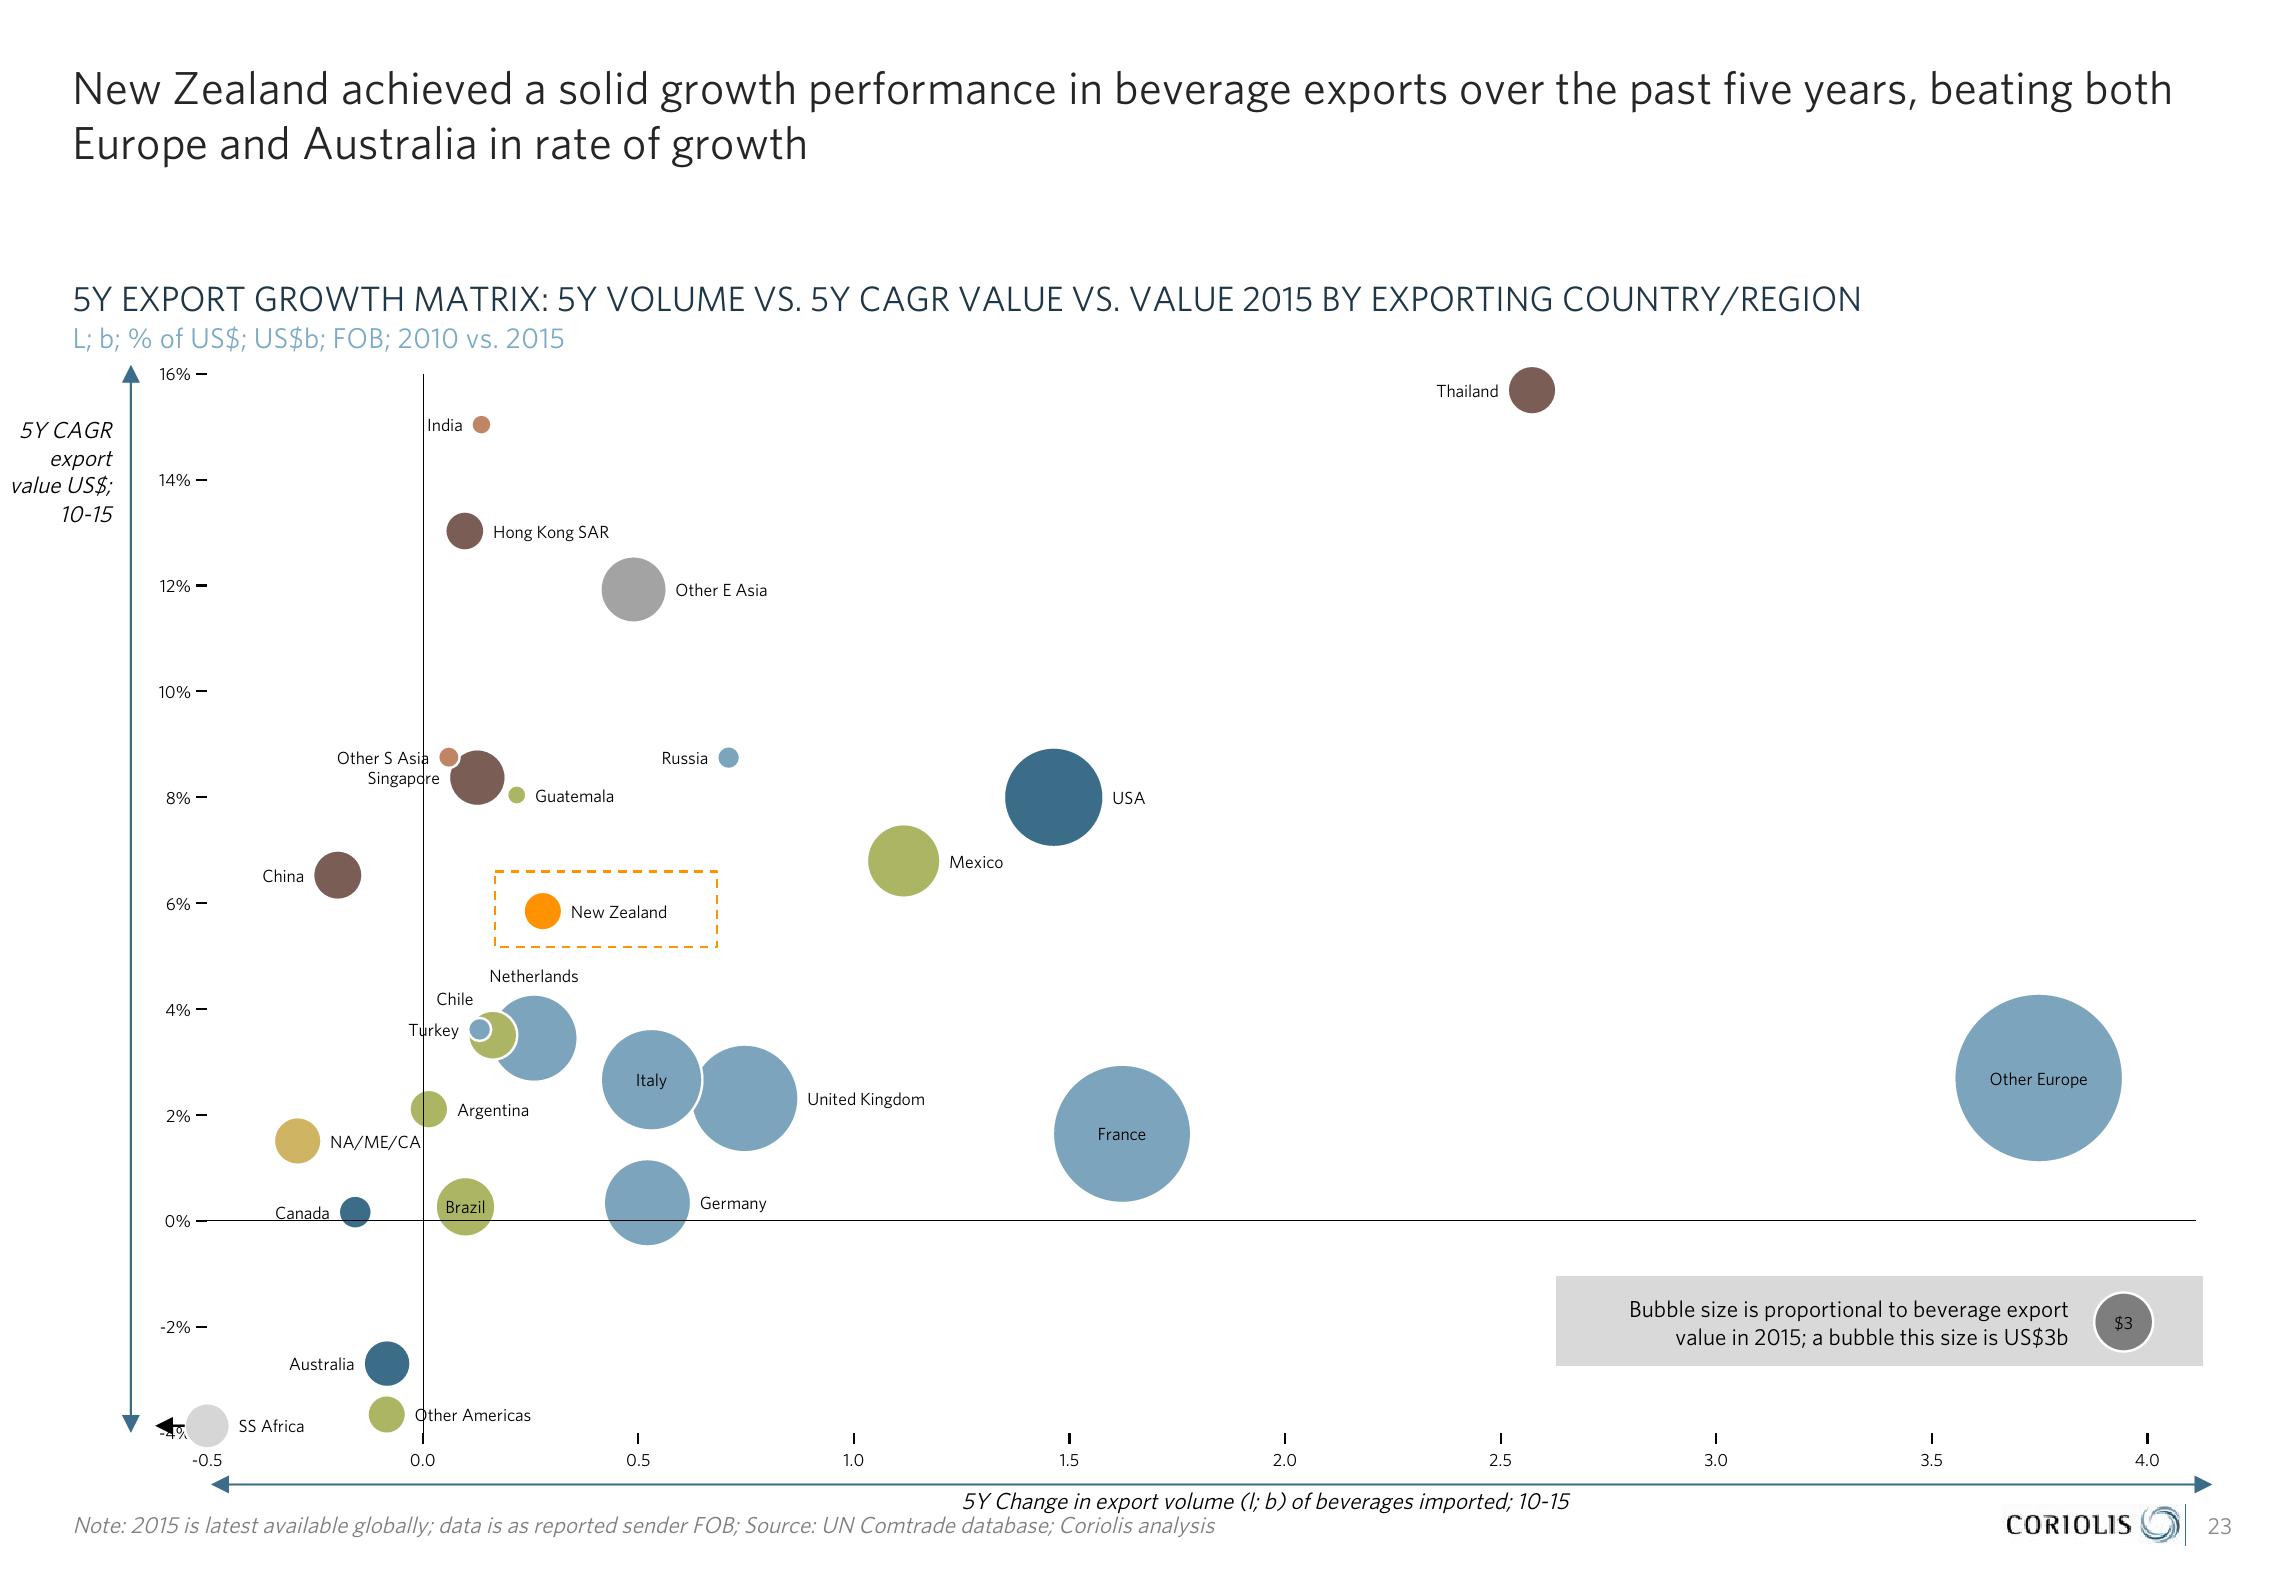
New Zealand achieved a solid growth performance in beverage exports over the past five years, beating both
Europe and Australia in rate of growth
5Y EXPORT GROWTH MATRIX: 5Y VOLUME VS. 5Y CAGR VALUE VS. VALUE 2015 BY EXPORTING COUNTRY/REGION
L; b; % of US$; US$b; FOB; 2010 vs. 2015
5Y CAGR
export
value US$;
10-15
16% -
14% -
India
Hong Kong SAR
12% -
10%-
Other E Asia
Other S Asia
Singapore
Russia
8%-
Guatemala
6%-
4% -
2% -
China
0%
Canada
New Zealand
Netherlands
Chile
Turkey
Mexico
USA
Italy
United Kingdom
Argentina
France
NA/ME/CA
Brazil
Germany
-2%-
Australia
Other Americas
SS Africa
-0.5
0.0
I
0.5
I
1.0
Thailand
Other Europe
Bubble size is proportional to beverage export
value in 2015; a bubble this size is US$3b
$3
I
1.5
I
2.0
I
I
I
2.5
3.0
3.5
5Y Change in export volume (l; b) of beverages imported; 10-15
Note: 2015 is latest available globally; data is as reported sender FOB; Source: UN Comtrade database; Coriolis analysis
CORIOLIS
I
4.0
23View entire presentation