Endeavour Mining Investor Presentation Deck
★
SABODALA-MASSAWA
Senegal
ROBUST ECONOMICS
FOR THE EXPANSION
PROJECT
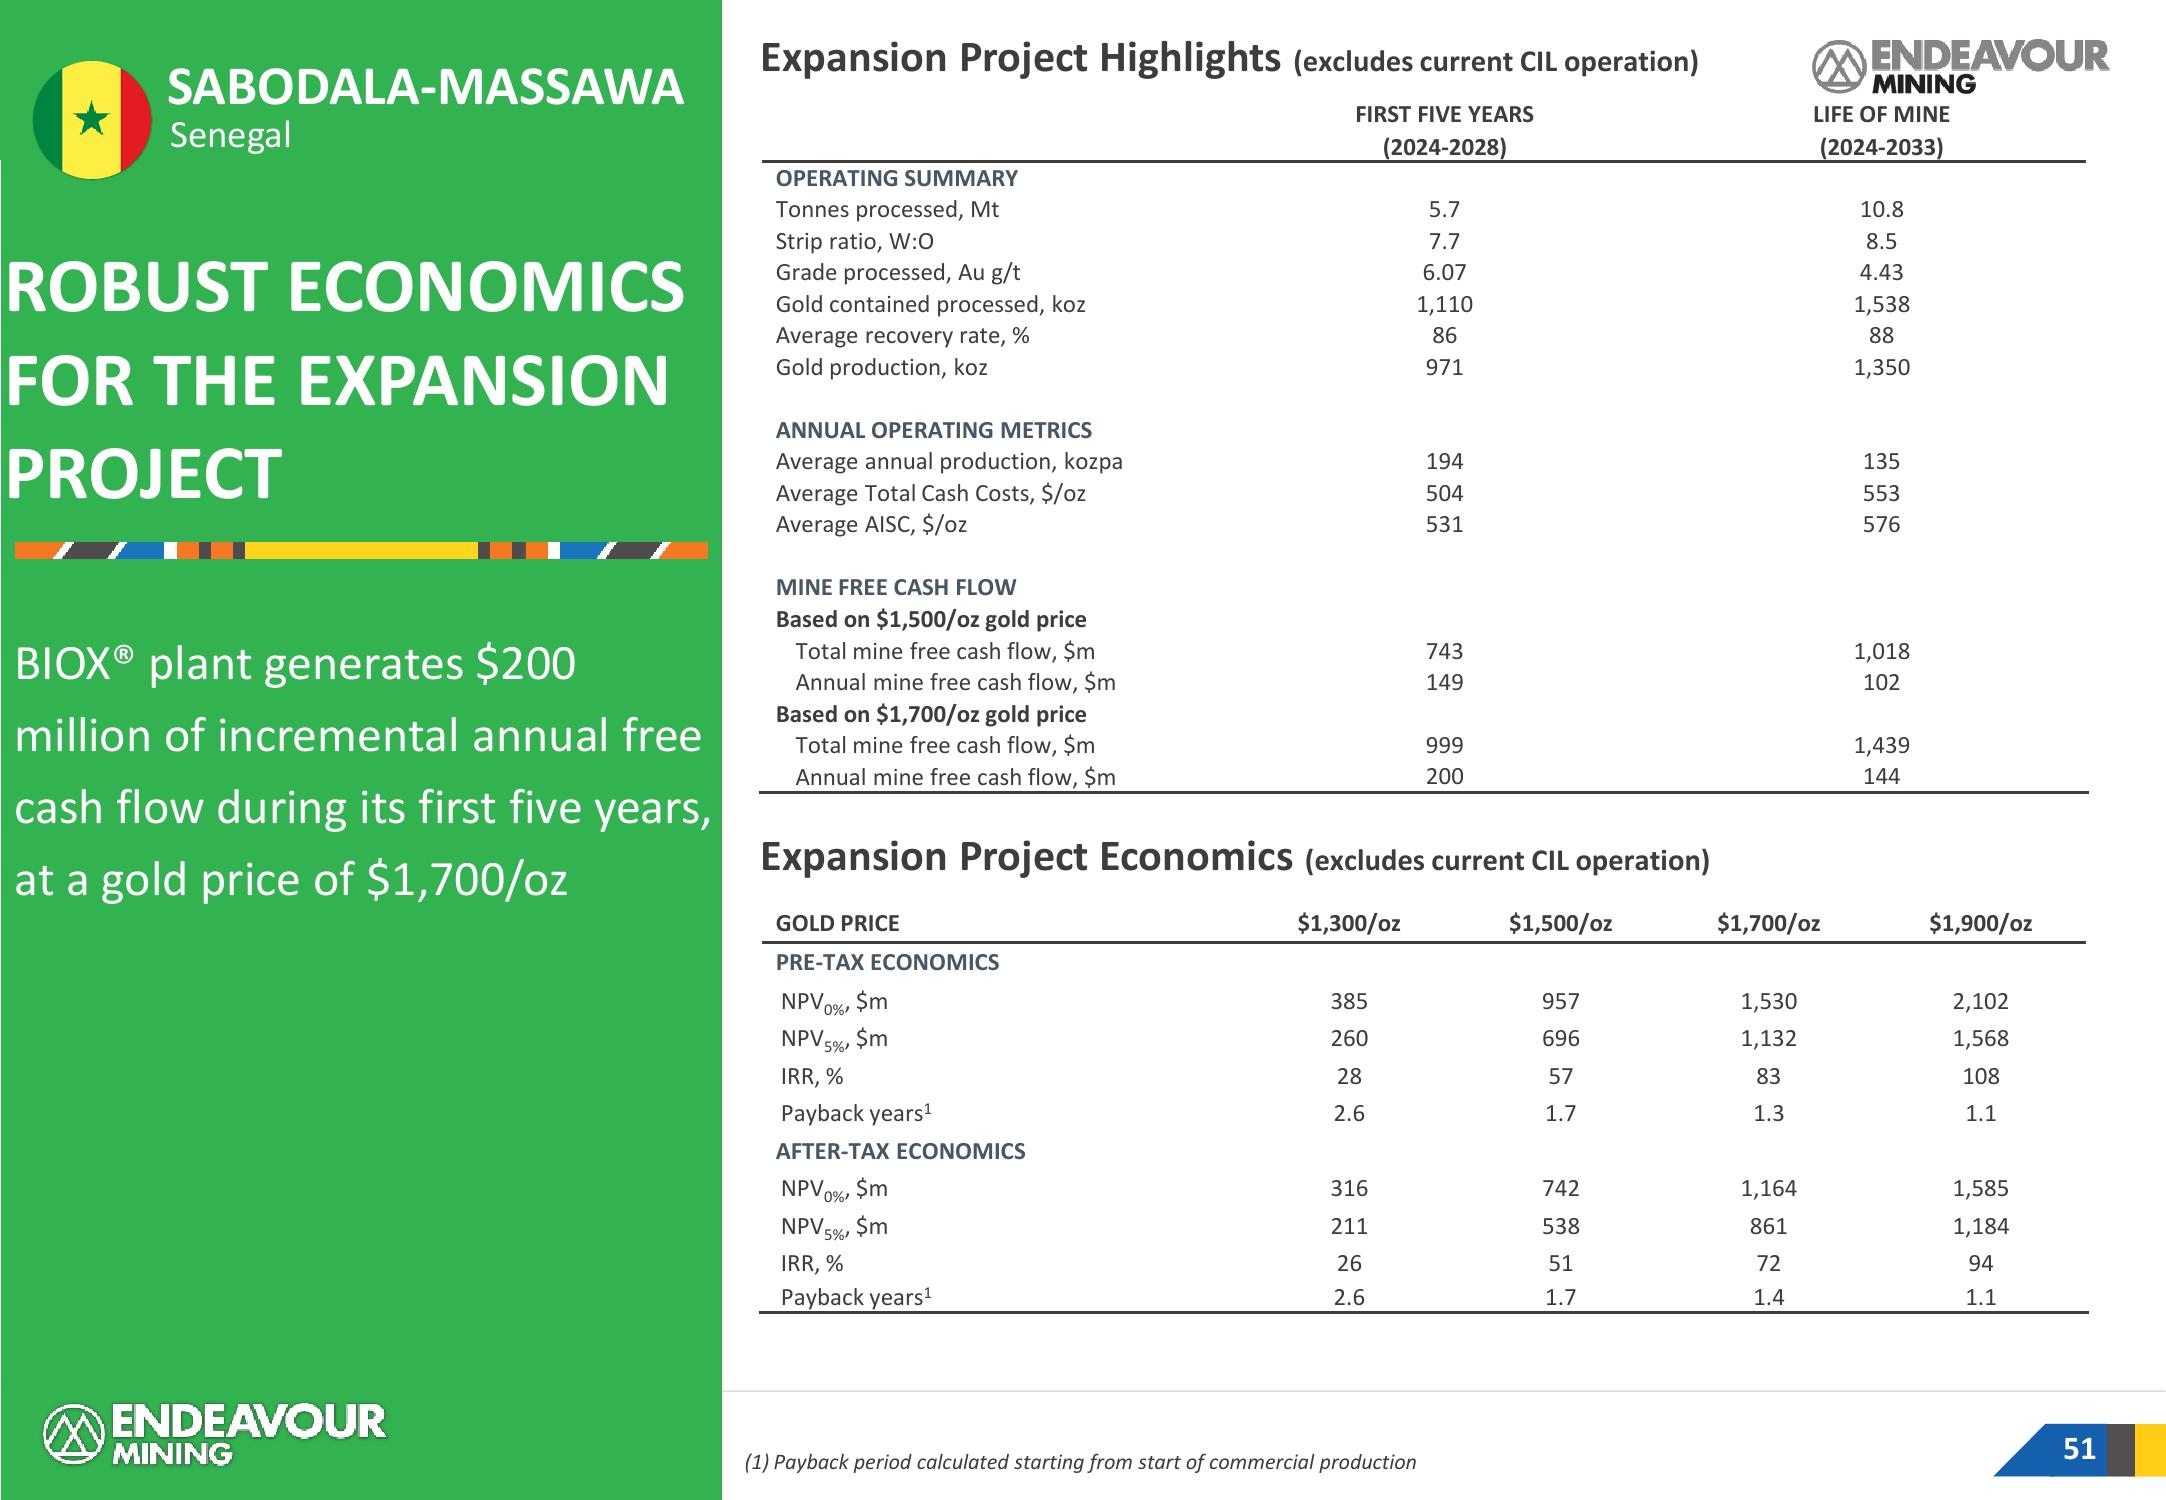
BIOX® plant generates $200
million of incremental annual free
cash flow during its first five years,
at a gold price of $1,700/oz
ENDEAVOUR
MINING
Expansion Project Highlights (excludes current CIL operation)
FIRST FIVE YEARS
(2024-2028)
OPERATING SUMMARY
Tonnes processed, Mt
Strip ratio, W:0
Grade processed, Au g/t
Gold contained processed, koz
Average recovery rate, %
Gold production, koz
ANNUAL OPERATING METRICS
Average annual production, kozpa
Average Total Cash Costs, $/oz
Average AISC, $/oz
MINE FREE CASH FLOW
Based on $1,500/oz gold price
Total mine free cash flow, $m
Annual mine free cash flow, $m
Based on $1,700/oz gold price
Total mine free cash flow, $m
Annual mine free cash flow, $m
GOLD PRICE
PRE-TAX ECONOMICS
NPV0%, $m
NPV5 $m
5%'
IRR, %
Payback years¹
AFTER-TAX ECONOMICS
NPV 0%
$m
NPV 5%, $m
IRR, %
Payback years¹
Expansion Project Economics (excludes current CIL operation)
$1,300/oz
$1,500/oz
385
260
28
2.6
316
211
26
2.6
5.7
7.7
6.07
(1) Payback period calculated starting from start of commercial production
1,110
86
971
194
504
531
743
149
999
200
957
696
57
1.7
742
538
51
1.7
$1,700/oz
1,530
1,132
83
1.3
1,164
861
72
1.4
ENDEAVOUR
MINING
LIFE OF MINE
(2024-2033)
10.8
8.5
4.43
1,538
88
1,350
135
553
576
1,018
102
1,439
144
$1,900/oz
2,102
1,568
108
1.1
1,585
1,184
94
1.1
51View entire presentation