Marti Investor Presentation Deck
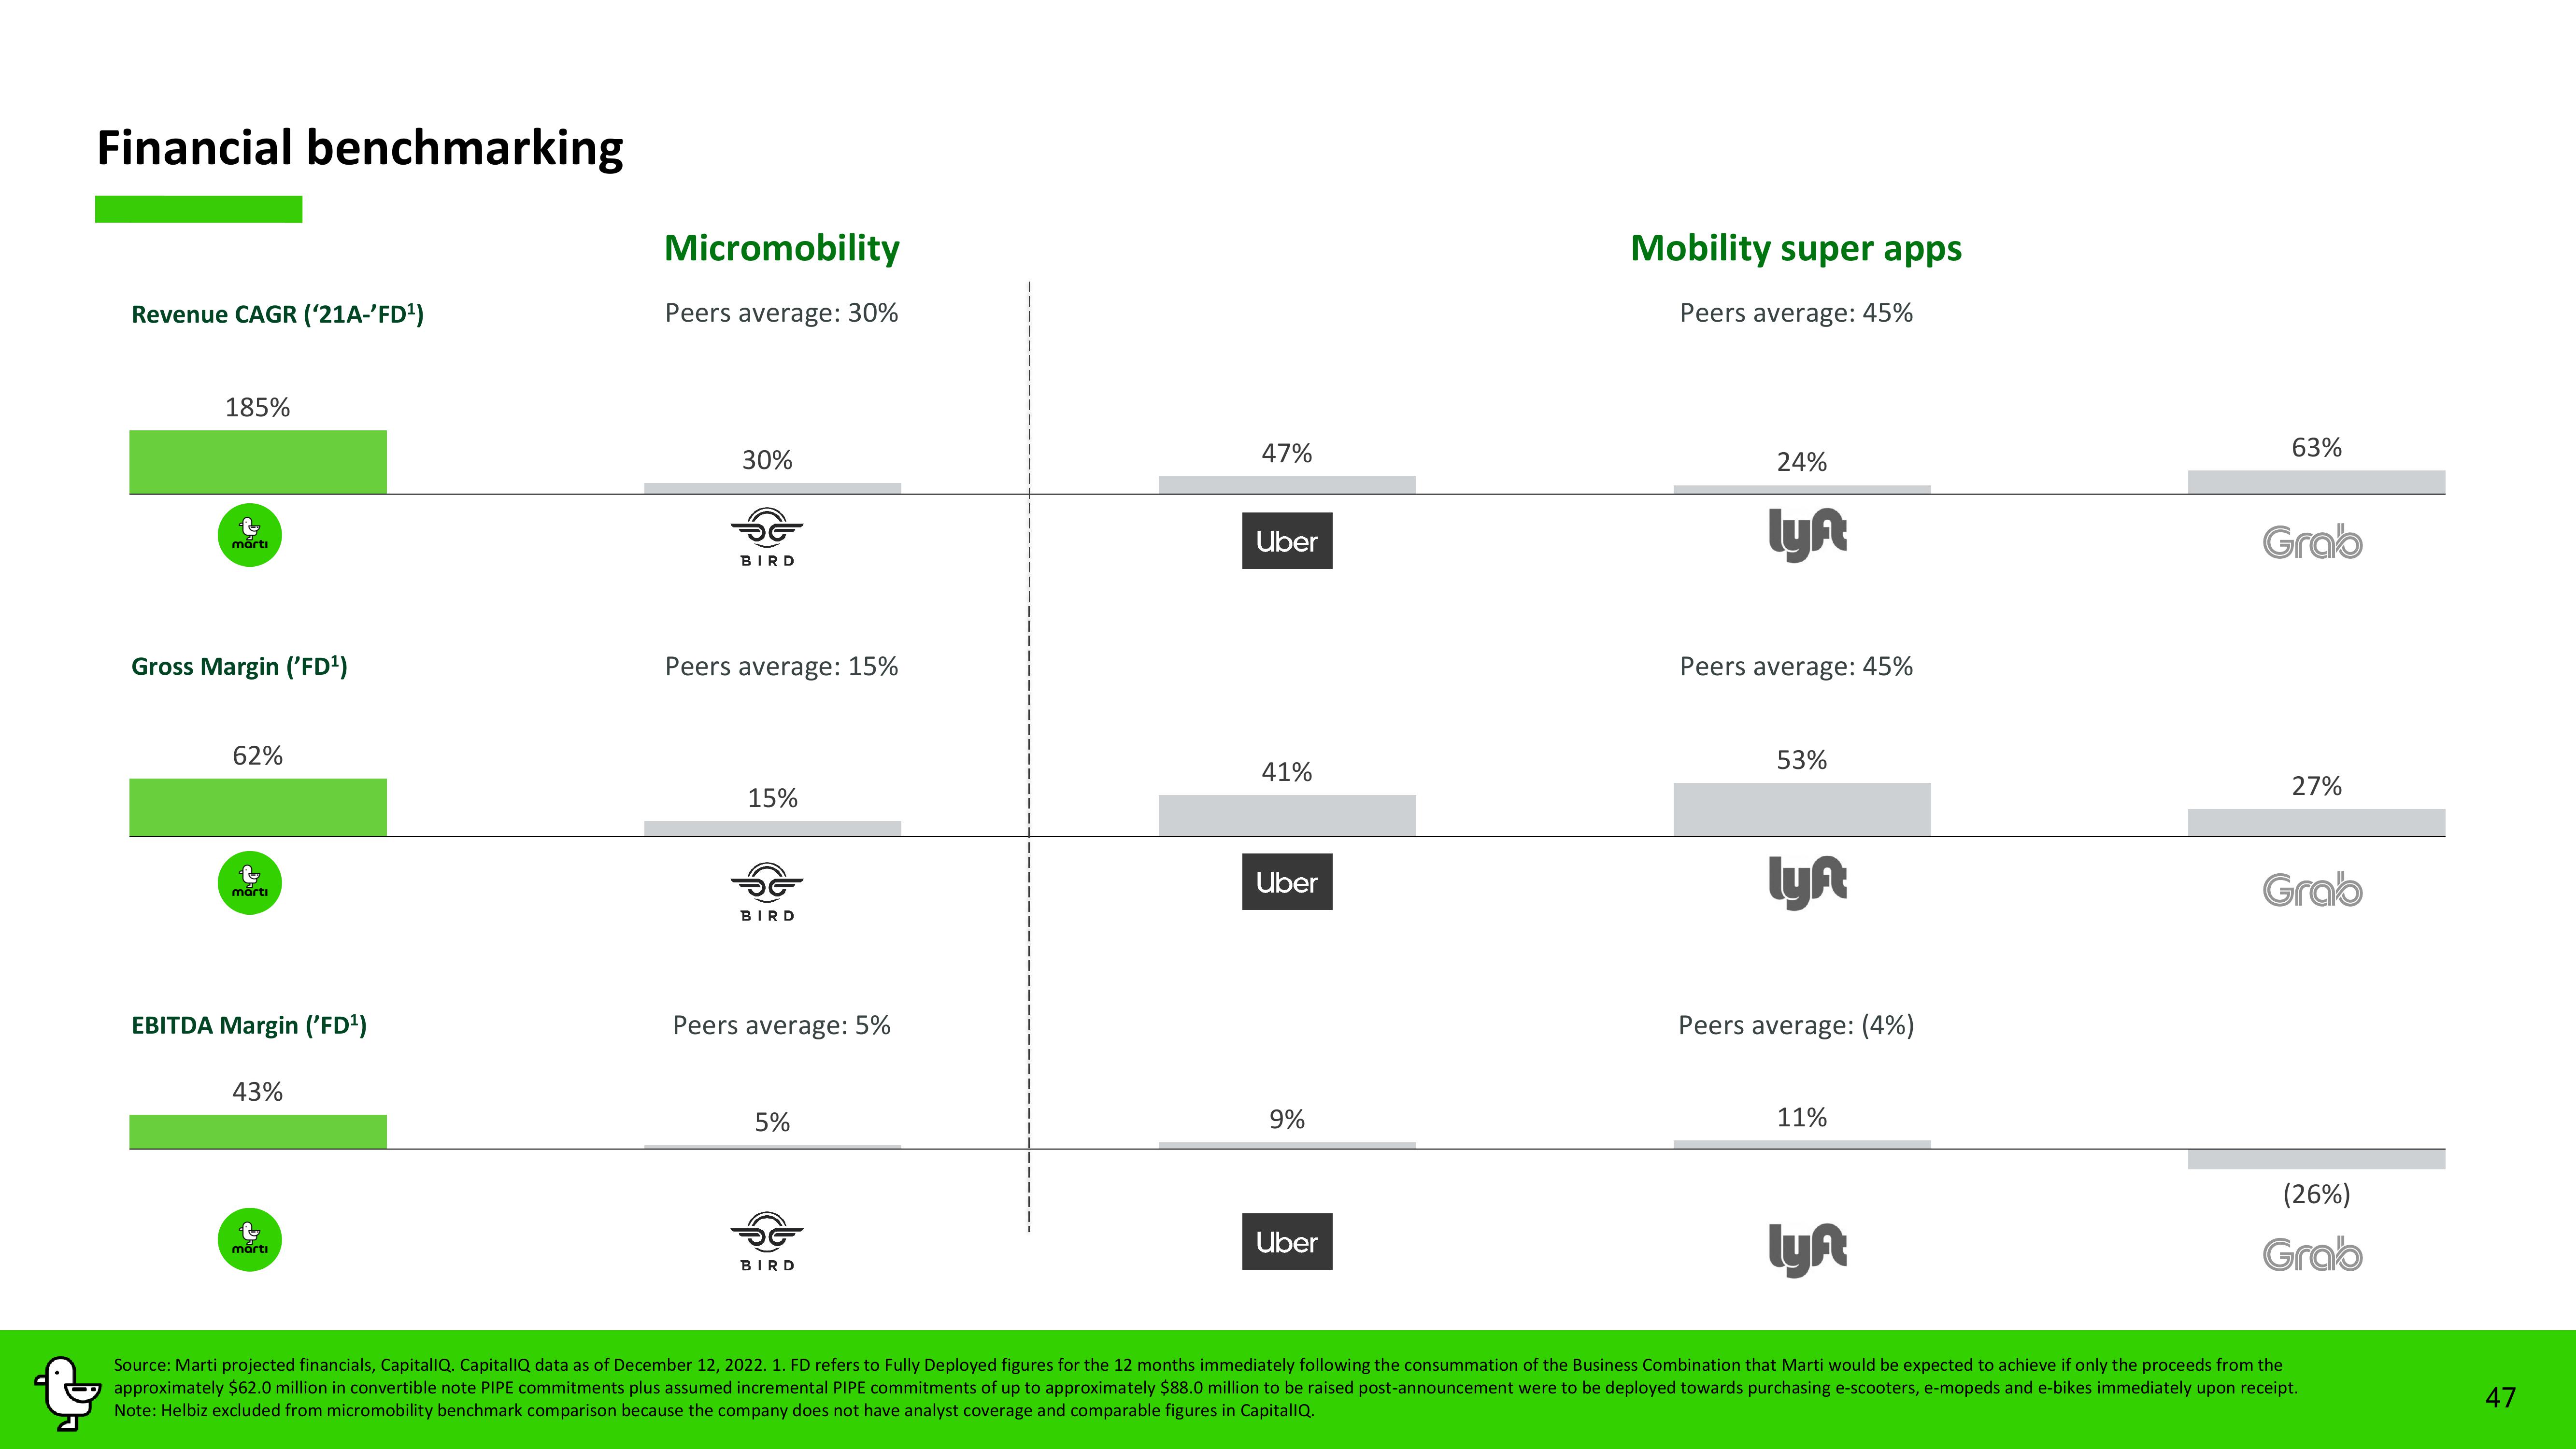
Financial benchmarking
Revenue CAGR ('21A-'FD¹)
185%
&
marti
Gross Margin ('FD¹)
62%
P
marti
EBITDA Margin ('FD¹)
43%
t
marti
Micromobility
Peers average: 30%
30%
BIRD
Peers average: 15%
15%
BIRD
Peers average: 5%
5%
47%
BIRD
Uber
41%
Uber
9%
Uber
Mobility super apps
Peers average: 45%
24%
lyn
Peers average: 45%
53%
lyn
Peers average: (4%)
11%
63%
Grab
27%
Grab
(26%)
Grab
lyn
Source: Marti projected financials, CapitallQ. CapitallQ data as of December 12, 2022. 1. FD refers to Fully Deployed figures for the 12 months immediately following the consummation of the Business Combination that Marti would be expected to achieve if only the proceeds from the
approximately $62.0 million in convertible note PIPE commitments plus assumed incremental PIPE commitments of up to approximately $88.0 million to be raised post-announcement were to be deployed towards purchasing e-scooters, e-mopeds and e-bikes immediately upon receipt.
Note: Helbiz excluded from micromobility benchmark comparison because the company does not have analyst coverage and comparable figures in CapitalIQ.
47View entire presentation