Kymera Investor Presentation Deck
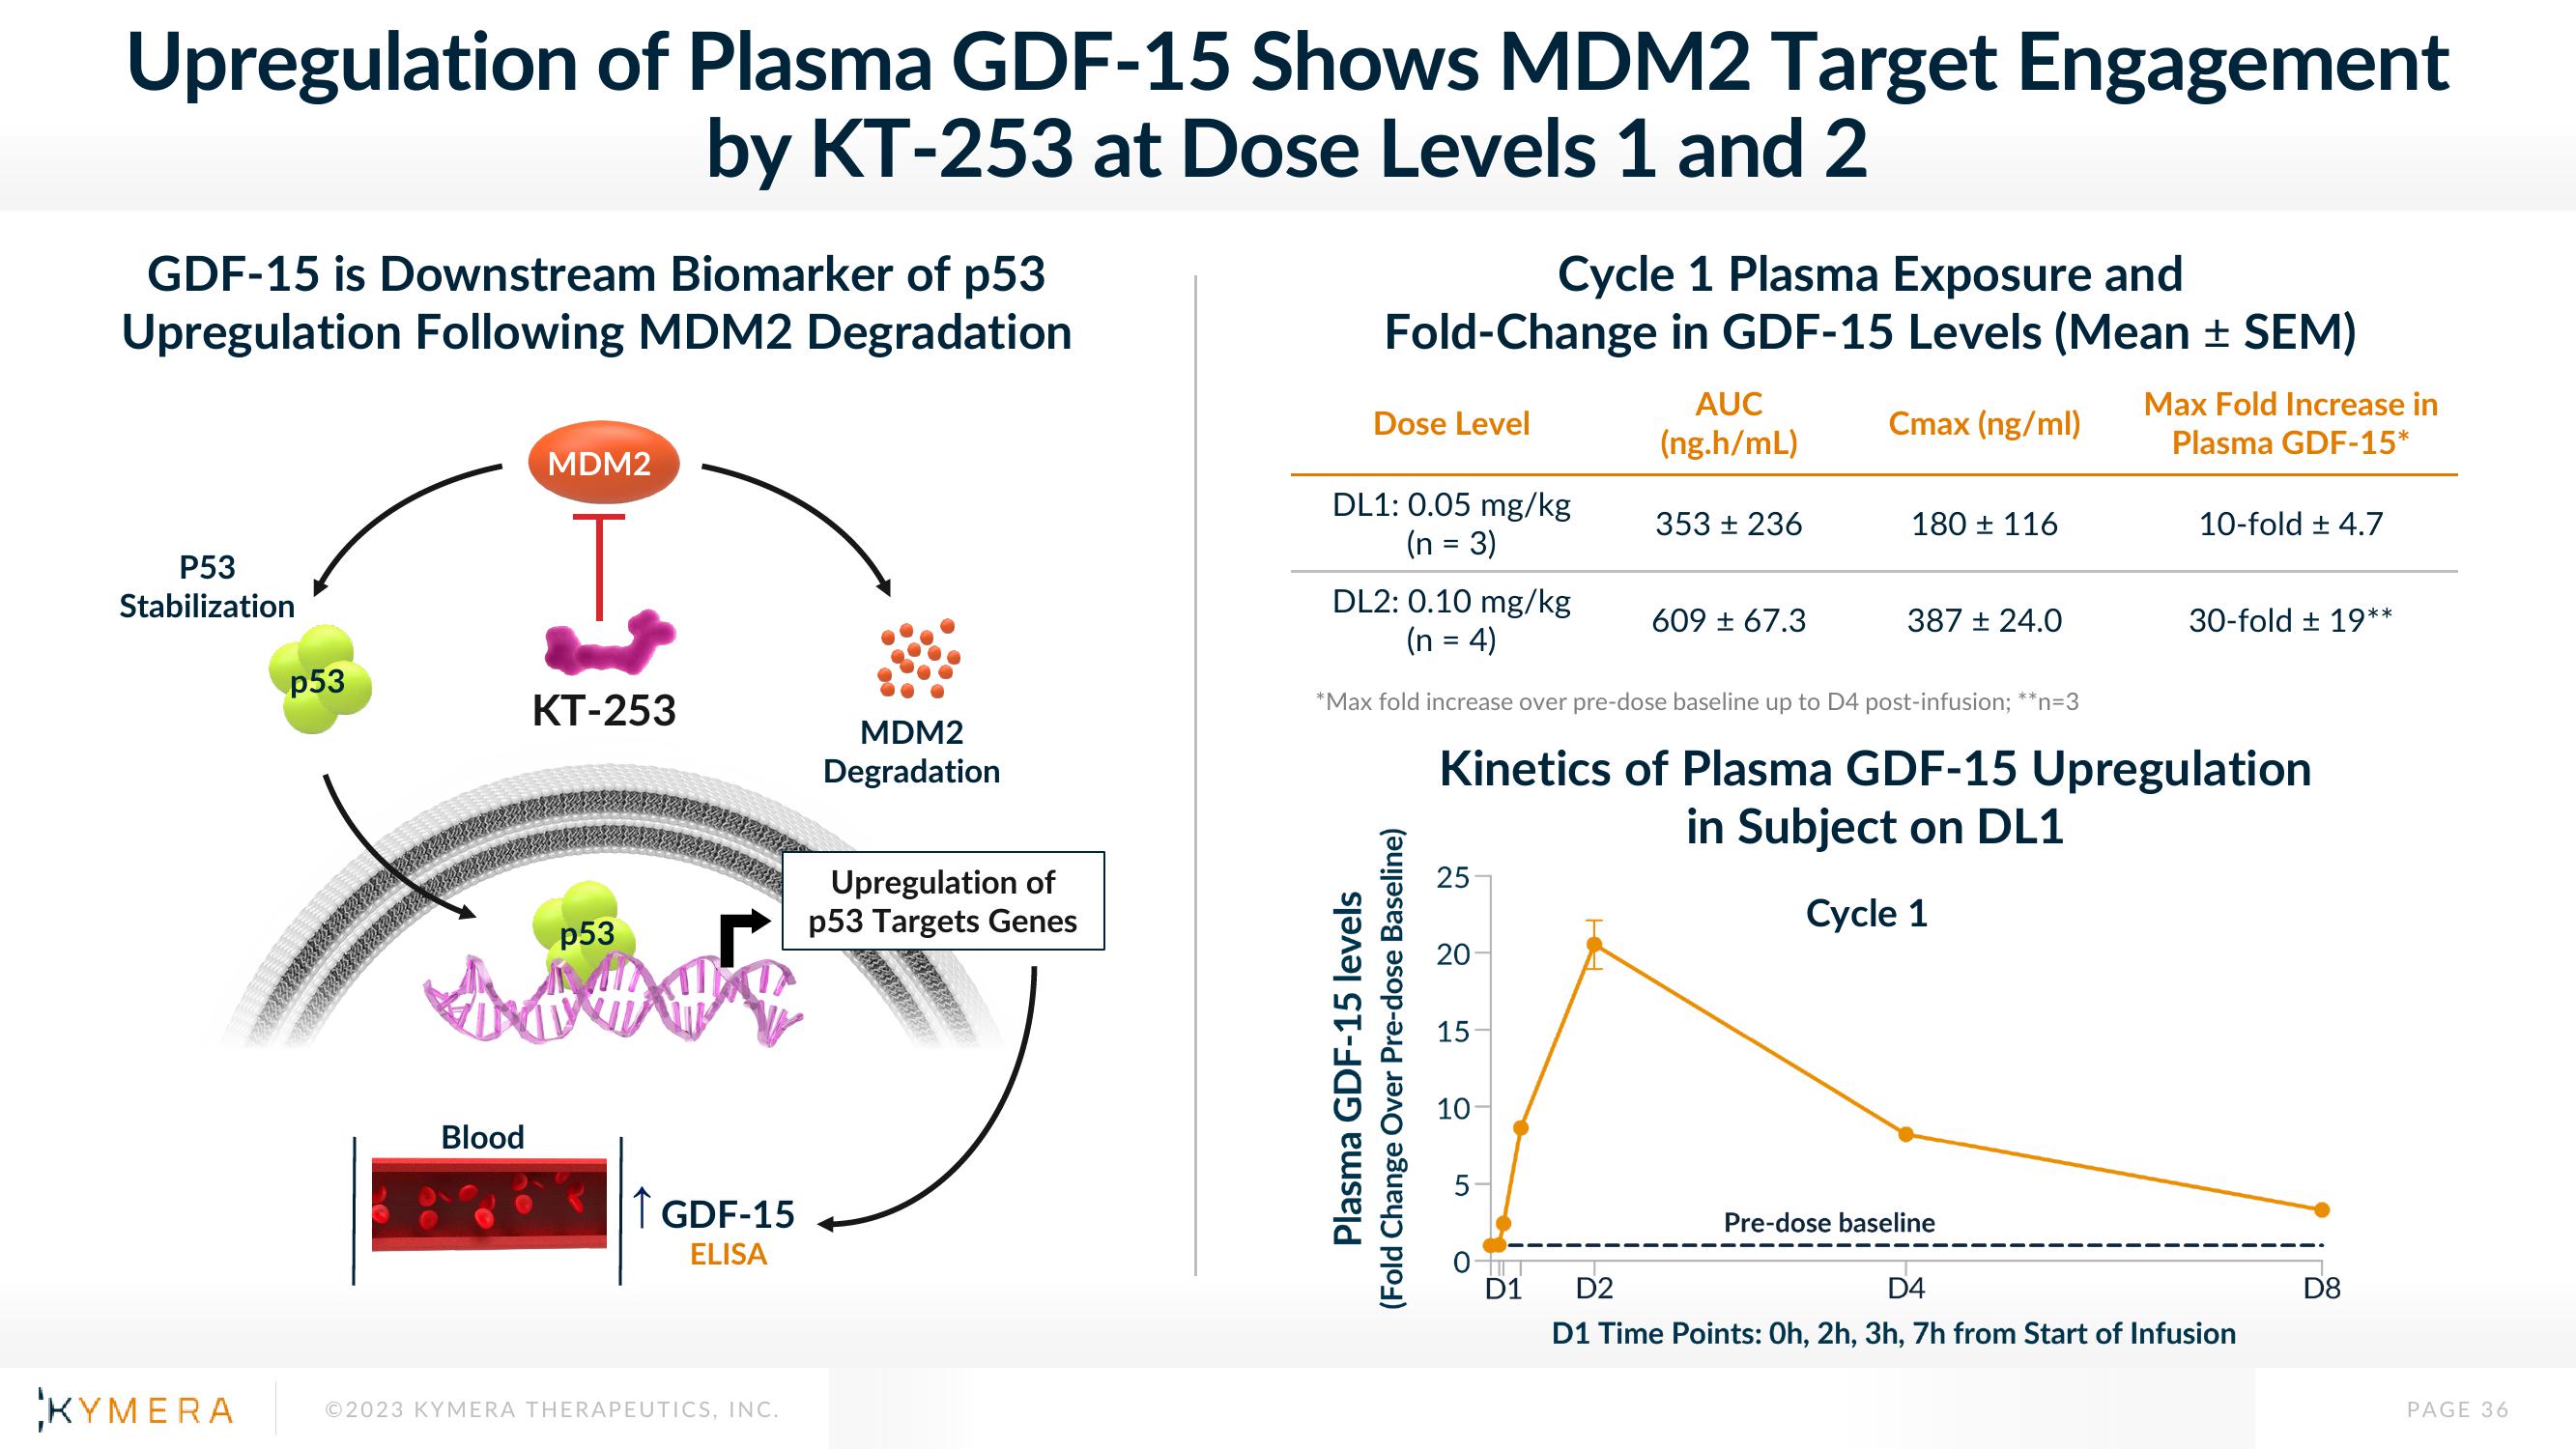
Upregulation of Plasma GDF-15 Shows MDM2 Target Engagement
by KT-253 at Dose Levels 1 and 2
GDF-15 is Downstream Biomarker of p53
Upregulation Following MDM2 Degradation
P53
Stabilization
KYMERA
p53
Blood
MDM2
KT-253
p53
11
MDM2
Degradation
©2023 KYMERA THERAPEUTICS, INC.
Upregulation of
p53 Targets Genes
GDF-15-
ELISA
Cycle 1 Plasma Exposure and
Fold-Change in GDF-15 Levels (Mean ± SEM)
Dose Level
DL1: 0.05 mg/kg
(n = 3)
DL2: 0.10 mg/kg
(n = 4)
Plasma GDF-15 levels
(Fold Change Over Pre-dose Baseline)
25
20
15
*Max fold increase over pre-dose baseline up to D4 post-infusion; **n=3
10-
AUC
(ng.h/mL)
5
353 ± 236
D1
609 ± 67.3
Cmax (ng/ml)
180 ± 116
Kinetics of Plasma GDF-15 Upregulation
in Subject on DL1
Cycle 1
387 ± 24.0
Max Fold Increase in
Plasma GDF-15*
Pre-dose baseline
10-fold 4.7
30-fold ± 19**
D4
D2
D1 Time Points: Oh, 2h, 3h, 7h from Start of Infusion
D8
PAGE 36View entire presentation