MoneyLion Results Presentation Deck
Quarterly Performance
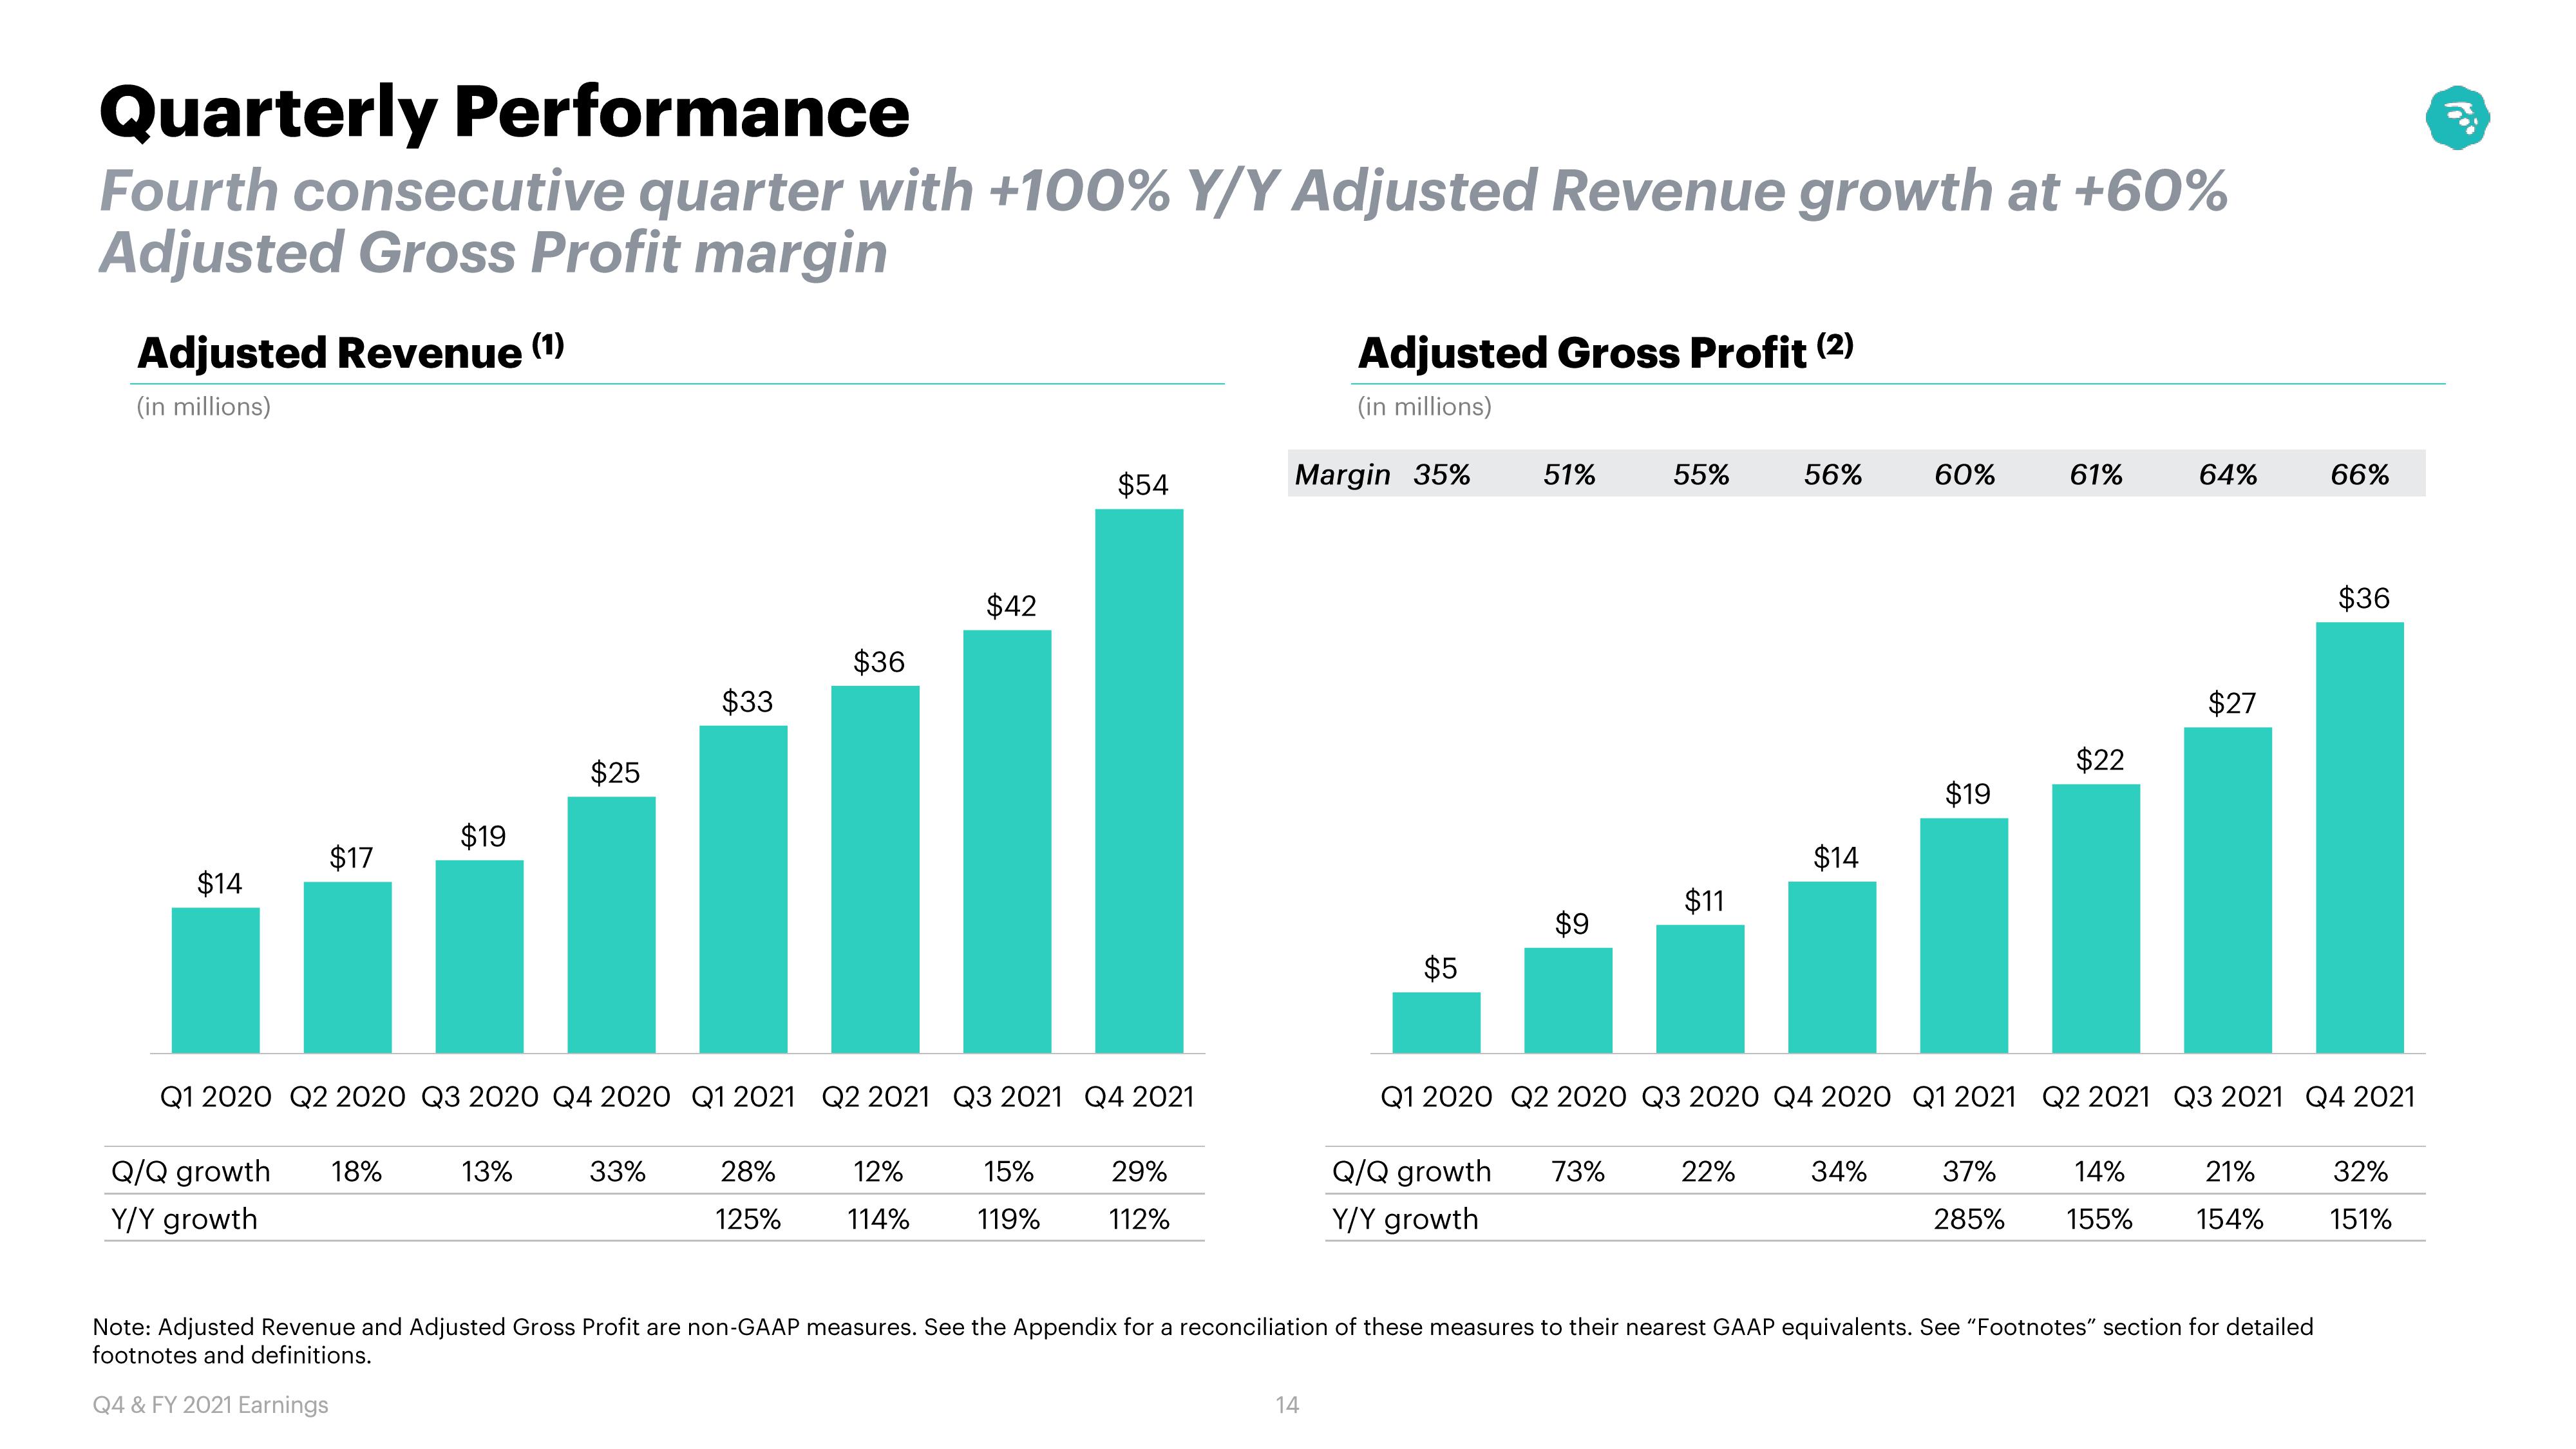
Fourth consecutive quarter with +100% Y/Y Adjusted Revenue growth at +60%
Adjusted Gross Profit margin
Adjusted Revenue (1)
(in millions)
$14
$17
$19
Q/Q growth 18%
Y/Y growth
$25
13%
$33
33%
Q1 2020 Q2 2020 Q3 2020 Q4 2020 Q1 2021 Q2 2021 Q3 2021 Q4 2021
$36
28%
125%
$42
12%
114%
$54
15%
119%
29%
112%
Adjusted Gross Profit (2)
(in millions)
Margin 35%
14
$5
51%
$9
55%
Q/Q growth 73%
Y/Y growth
$11
56%
22%
$14
60%
34%
$19
61%
37%
285%
$22
Q1 2020 Q2 2020 Q3 2020 Q4 2020 Q1 2021 Q2 2021 Q3 2021 Q4 2021
64%
14%
155%
$27
21%
154%
Note: Adjusted Revenue and Adjusted Gross Profit are non-GAAP measures. See the Appendix for a reconciliation of these measures to their nearest GAAP equivalents. See "Footnotes" section for detailed
footnotes and definitions.
Q4 & FY 2021 Earnings
66%
$36
32%
151%
10⁰View entire presentation