Bakkt Results Presentation Deck
FINANCIAL RESULTS / 2Q22 SUMMARY
Summary of 2Q22 condensed results
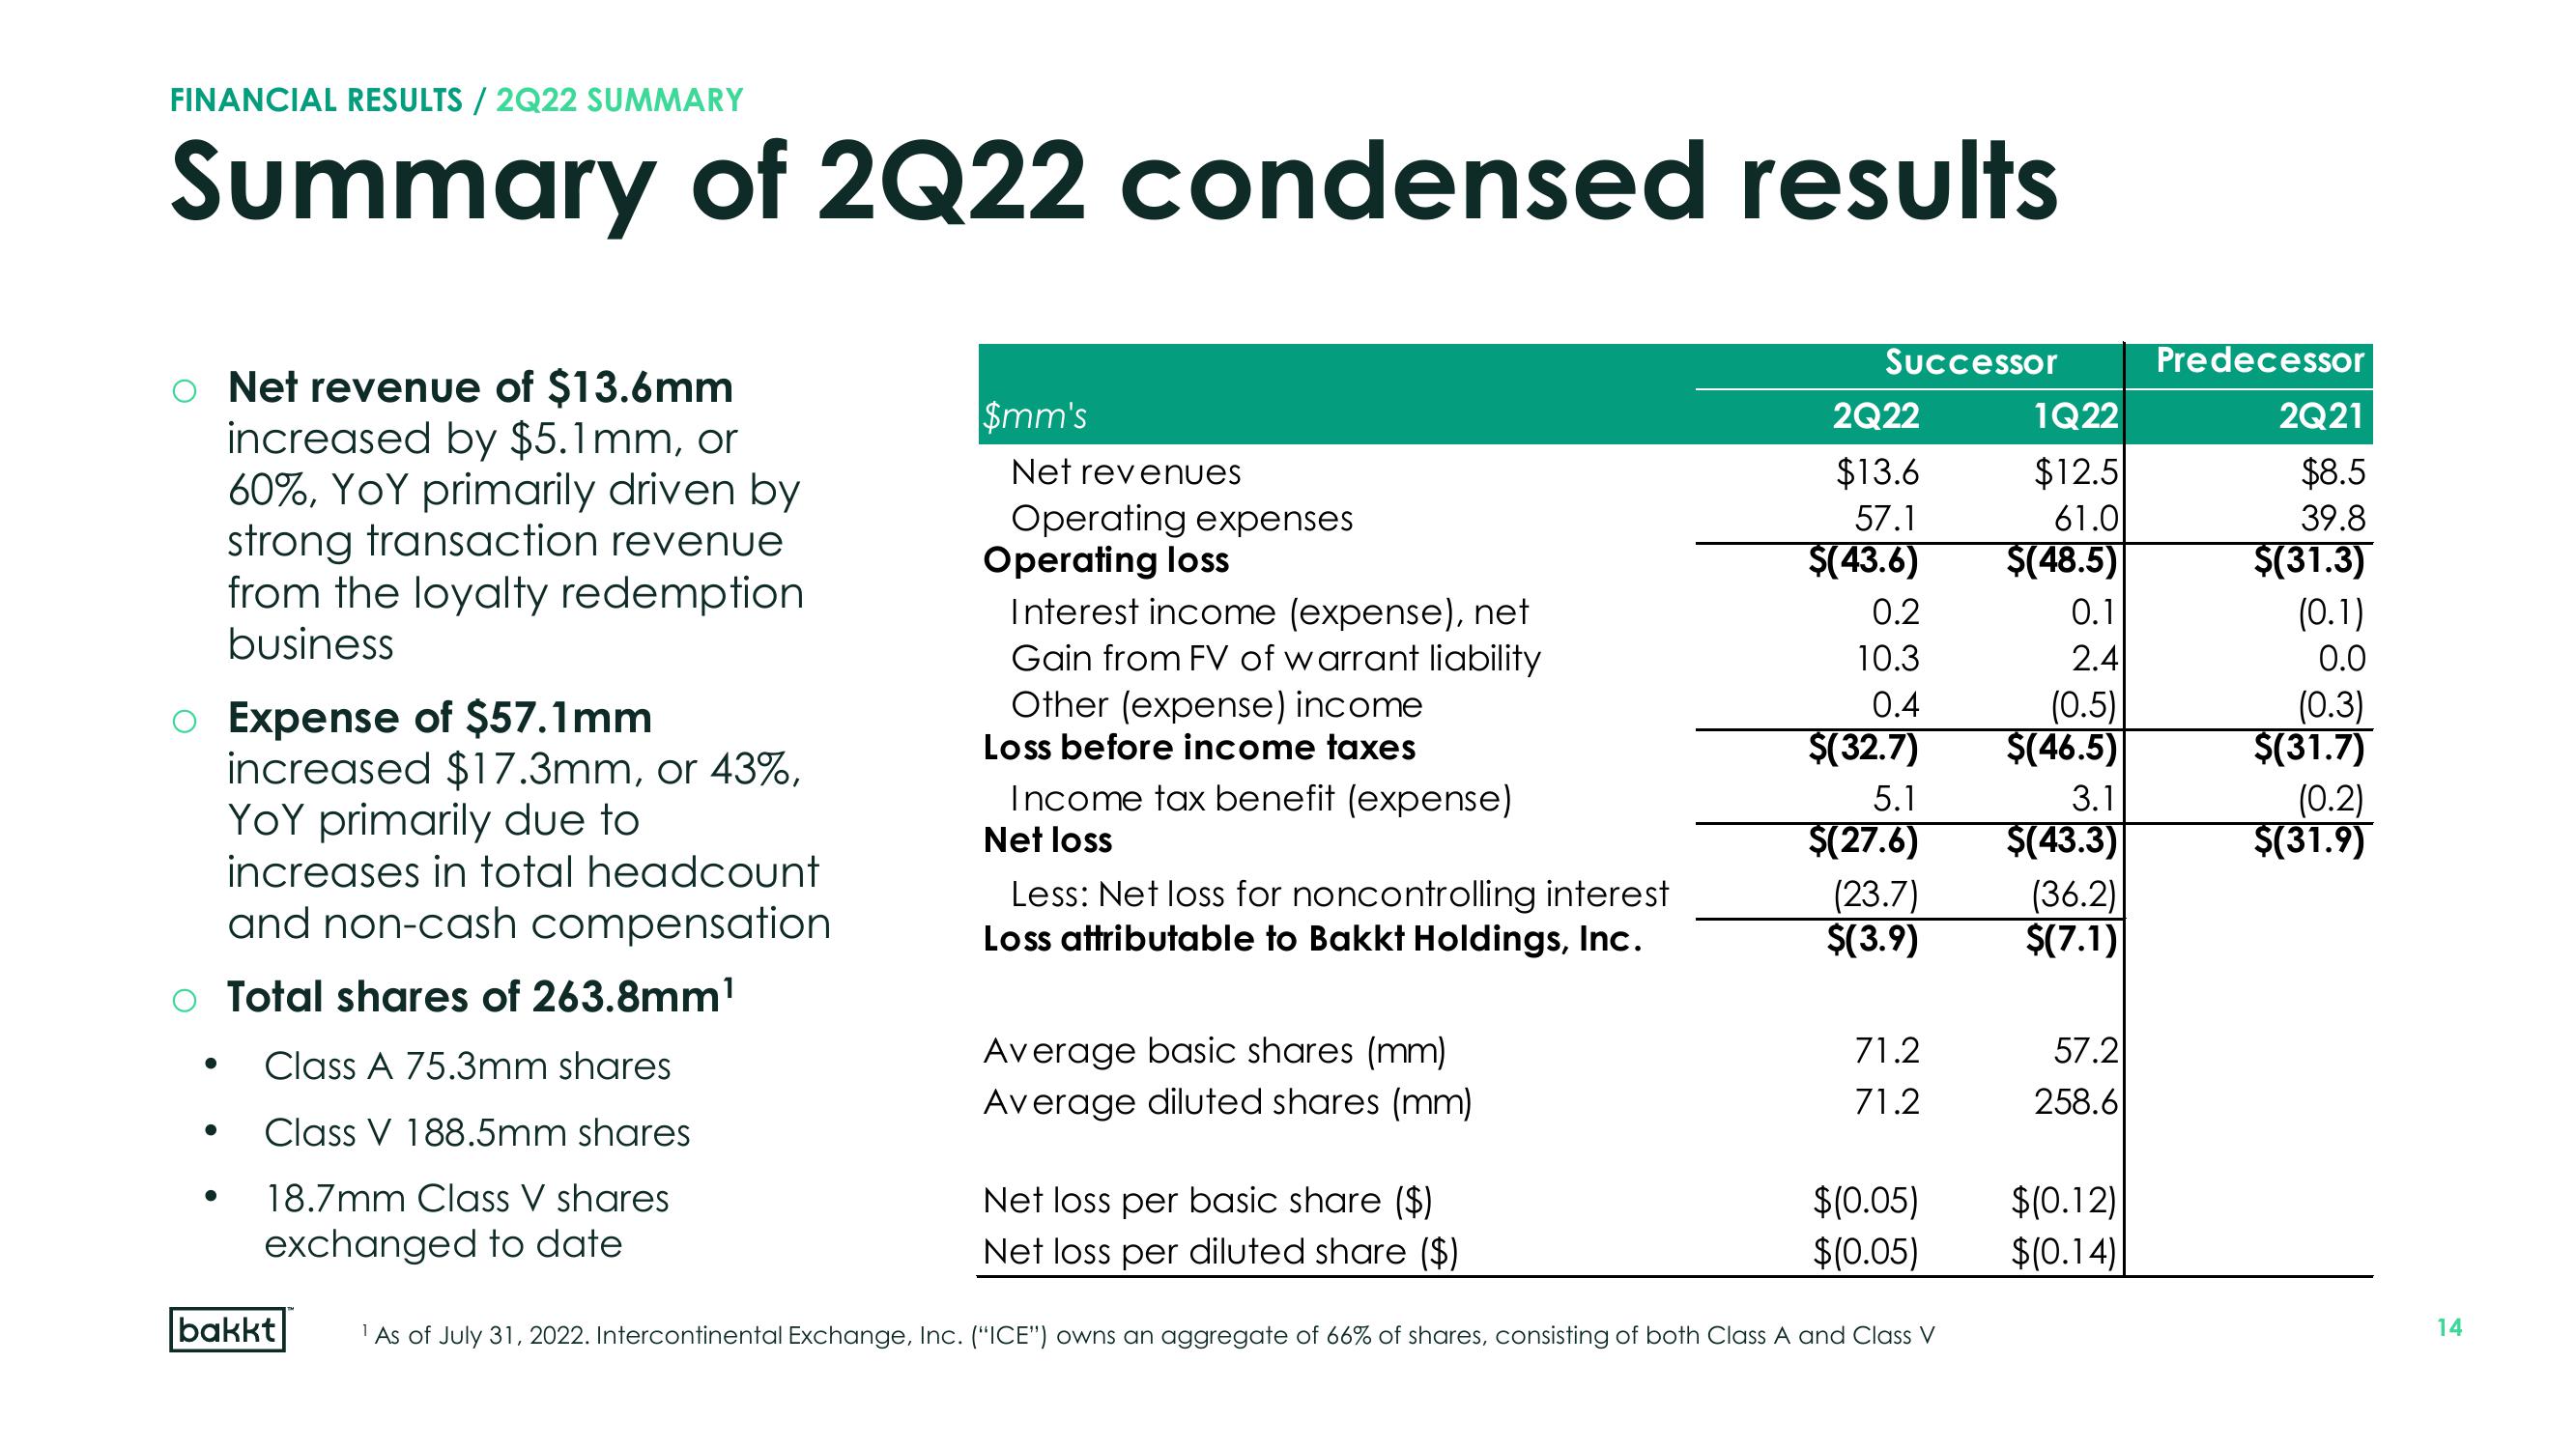
o Net revenue of $13.6mm
increased by $5.1mm, or
60%, YOY primarily driven by
strong transaction revenue
from the loyalty redemption
business
o Expense of $57.1mm
increased $17.3mm, or 43%,
YOY primarily due to
increases in total headcount
and non-cash compensation
O Total shares of 263.8mm¹
●
●
Class A 75.3mm shares
Class V 188.5mm shares
18.7mm Class V shares
exchanged to date
bakkt
$mm's
Net revenues
Operating expenses
Operating loss
Interest income (expense), net
Gain from FV of warrant liability
Other (expense) income
Loss before income taxes
Income tax benefit (expense)
Net loss
Less: Net loss for noncontrolling interest
Loss attributable to Bakkt Holdings, Inc.
Average basic shares (mm)
Average diluted shares (mm)
Net loss per basic share ($)
Net loss per diluted share ($)
Successor
2Q22
$13.6
57.1
$(43.6)
0.2
10.3
0.4
$(32.7)
5.1
$(27.6)
(23.7)
$(3.9)
71.2
71.2
$(0.05)
$(0.05)
¹ As of July 31, 2022. Intercontinental Exchange, Inc. ("ICE") owns an aggregate of 66% of shares, consisting of both Class A and Class V
1Q22
$12.5
61.0
$(48.5)
0.1
2.4
(0.5)
$(46.5)
3.1
$(43.3)
(36.2)
$(7.1)
57.2
258.6
$(0.12)
$(0.14)
Predecessor
2Q21
$8.5
39.8
$(31.3)
(0.1)
0.0
(0.3)
$(31.7)
(0.2)
$(31.9)
14View entire presentation