Proterra SPAC Presentation Deck
TRANSACTION SUMMARY
2020E
Median:
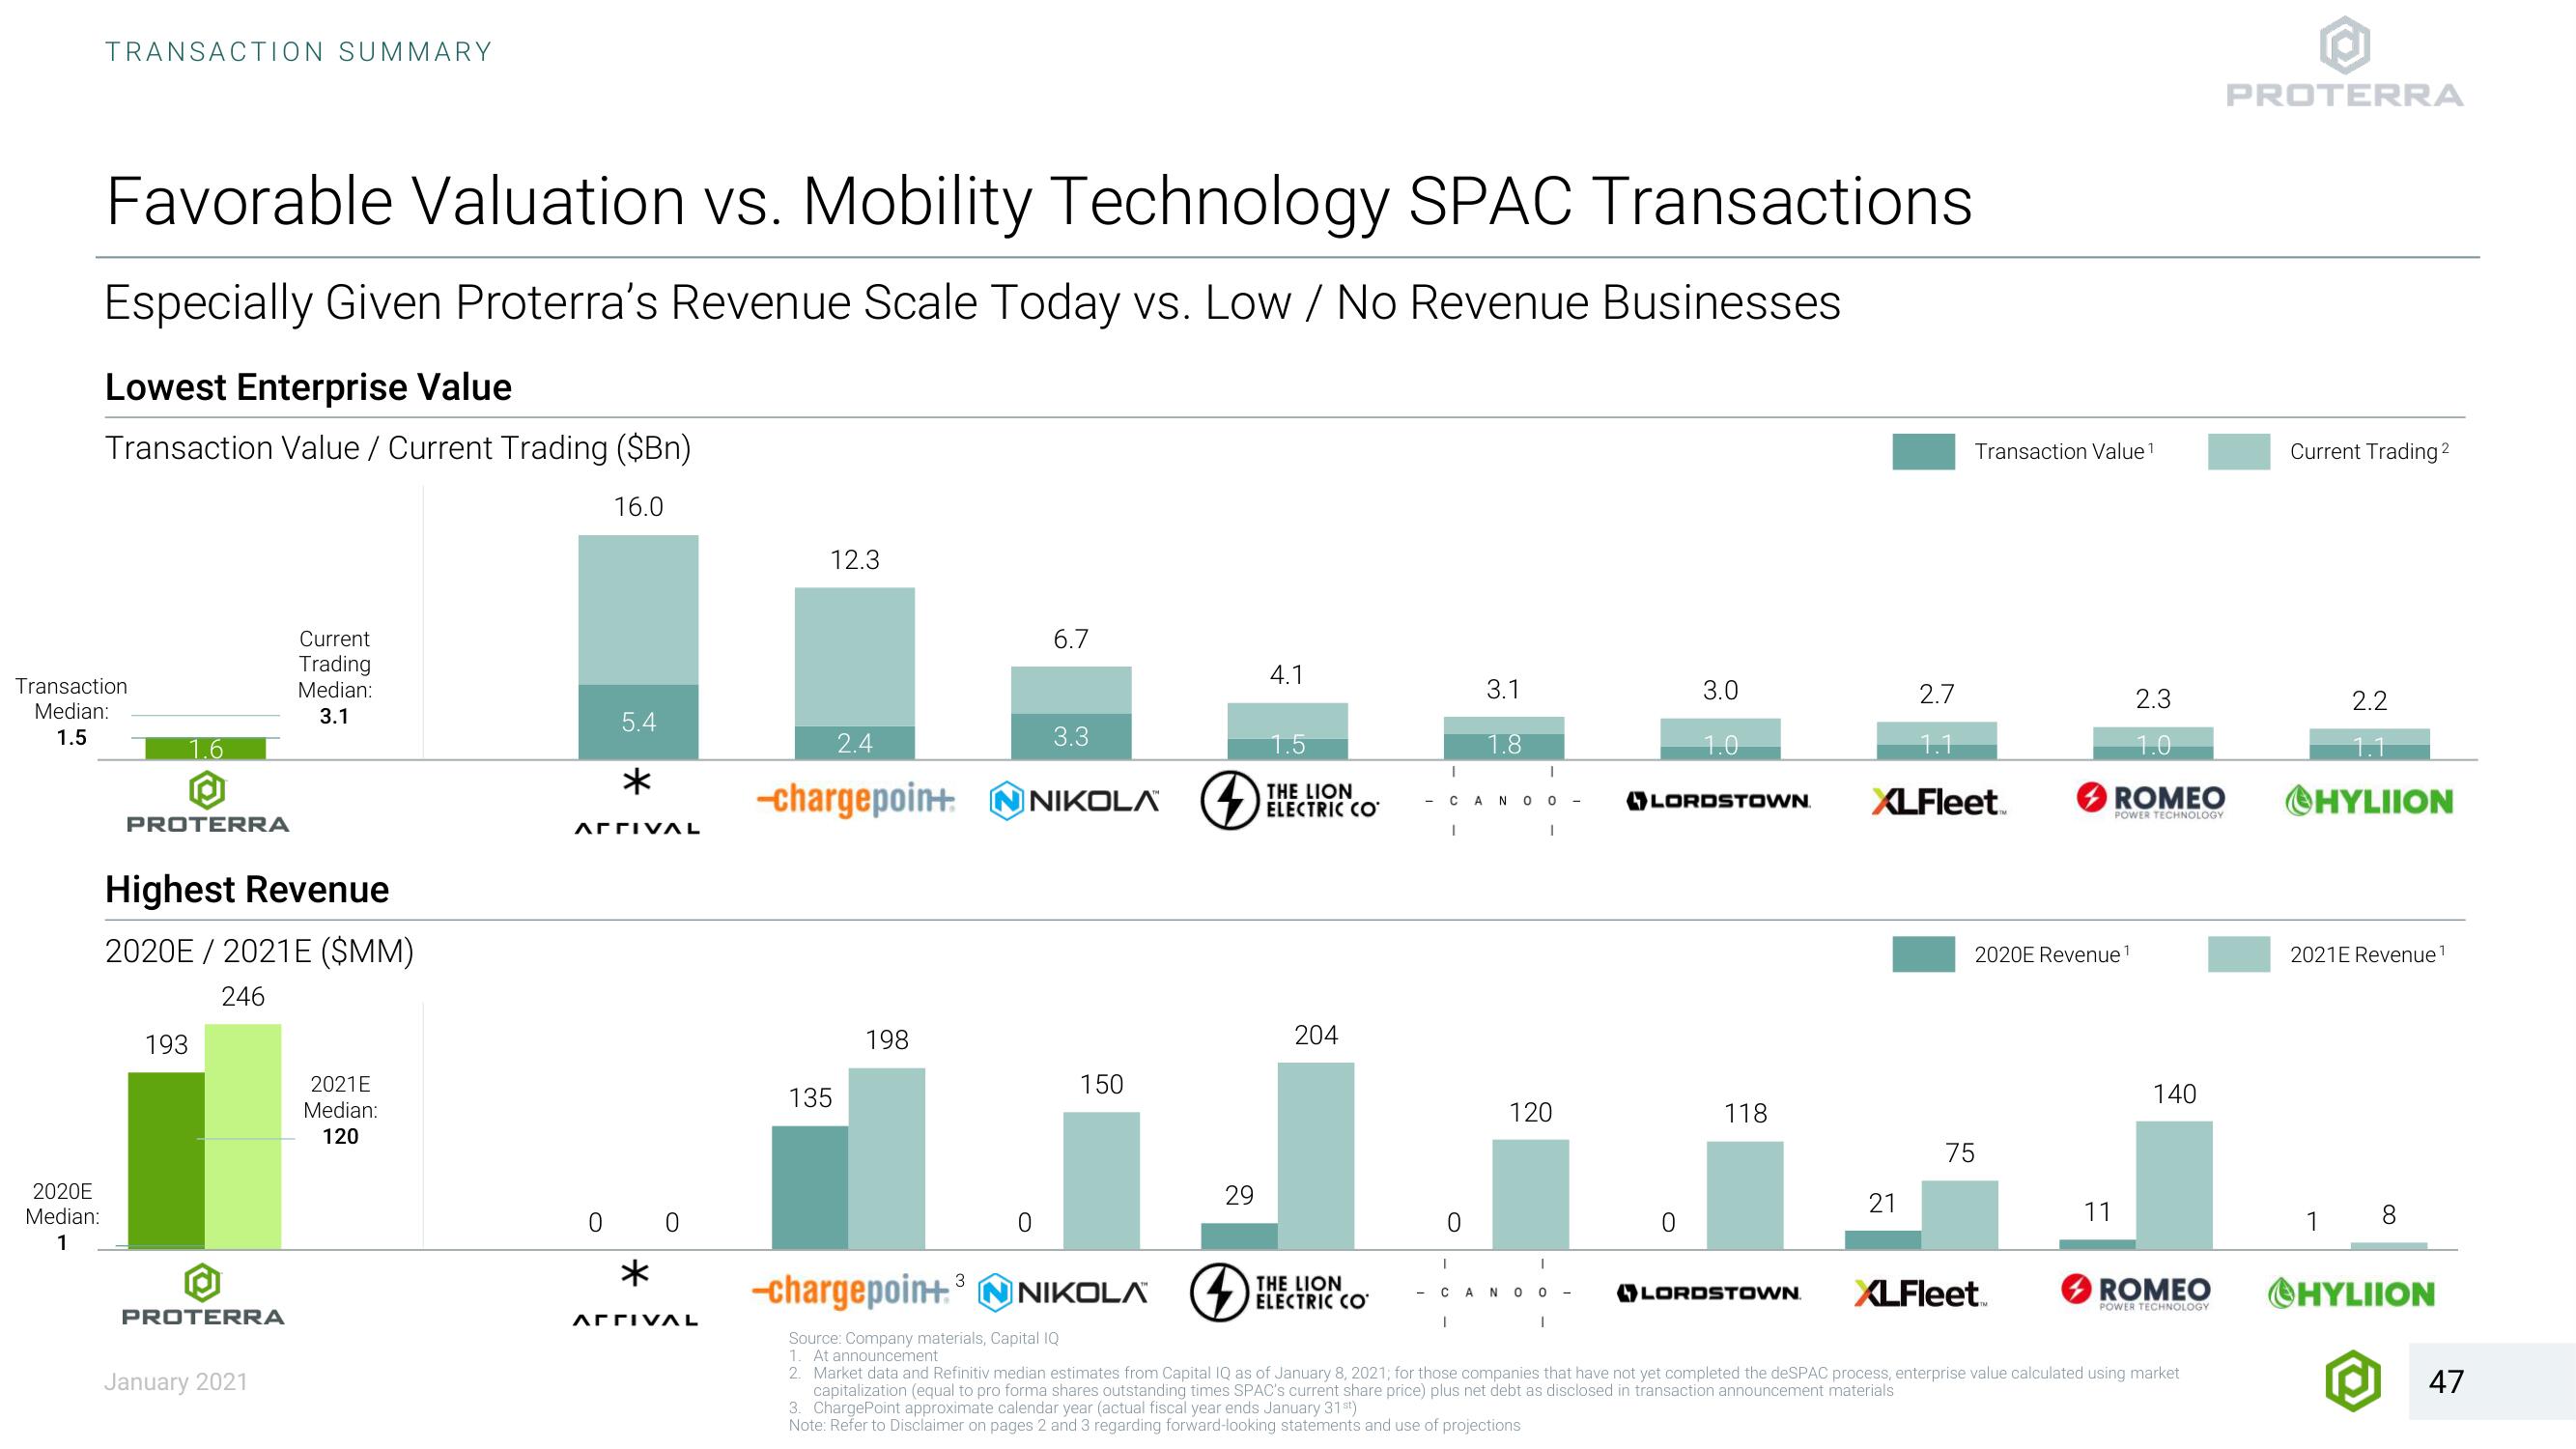
Favorable Valuation vs. Mobility Technology SPAC Transactions
Especially Given Proterra's Revenue Scale Today vs. Low / No Revenue Businesses
Lowest Enterprise Value
Transaction Value / Current Trading ($Bn)
16.0
Transaction
Median:
1.5
1.6
PROTERRA
Highest Revenue
2020E/2021E ($MM)
246
193
PROTERRA
Current
Trading
Median:
3.1
January 2021
2021E
Median:
120
5.4
*
ΑΓΓΙVAL
0 0
ΑΓΓΙVAL
12.3
2.4
3.3
-chargepoin+ N NIKOLA
NIKOLA
135
198
3
6.7
0
150
29
4
4.1
1.5
THE LION
ELECTRIC CO
204
THE LION
ELECTRIC CO
T
I
1
CANO 0
1
0
I
I
3.1
1.8
120
-CANOO-
3.0
1.0
LORDSTOWN.
118
LORDSTOWN.
Transaction Value ¹
2.7
1.1
XLFleet
21
-chargepoin+ NIKOLA
Source: Company materials, Capital IQ
1. At announcement
2. Market data and Refinitiv median estimates from Capital IQ of January 8, 2021, for those companies that have not yet completed the deSPAC process, enterprise value calculated using market
capitalization (equal to pro forma shares outstanding times SPAC's current share price) plus net debt as disclosed in transaction announcement materials
3. ChargePoint approximate calendar year (actual fiscal year ends January 31st)
Note: Refer to Disclaimer on pages 2 and 3 regarding forward-looking statements and use of projections
2020E Revenue ¹
75
2.3
1.0
ROMEO
POWER TECHNOLOGY
11
XLFleet
140
ROMEO
POWER TECHNOLOGY
PROTERRA
Current Trading 2²
2.2
1.1
HYLIION
2021E Revenue ¹
1 8
ⒸHYLIION
47View entire presentation