Ashtead Group Results Presentation Deck
10
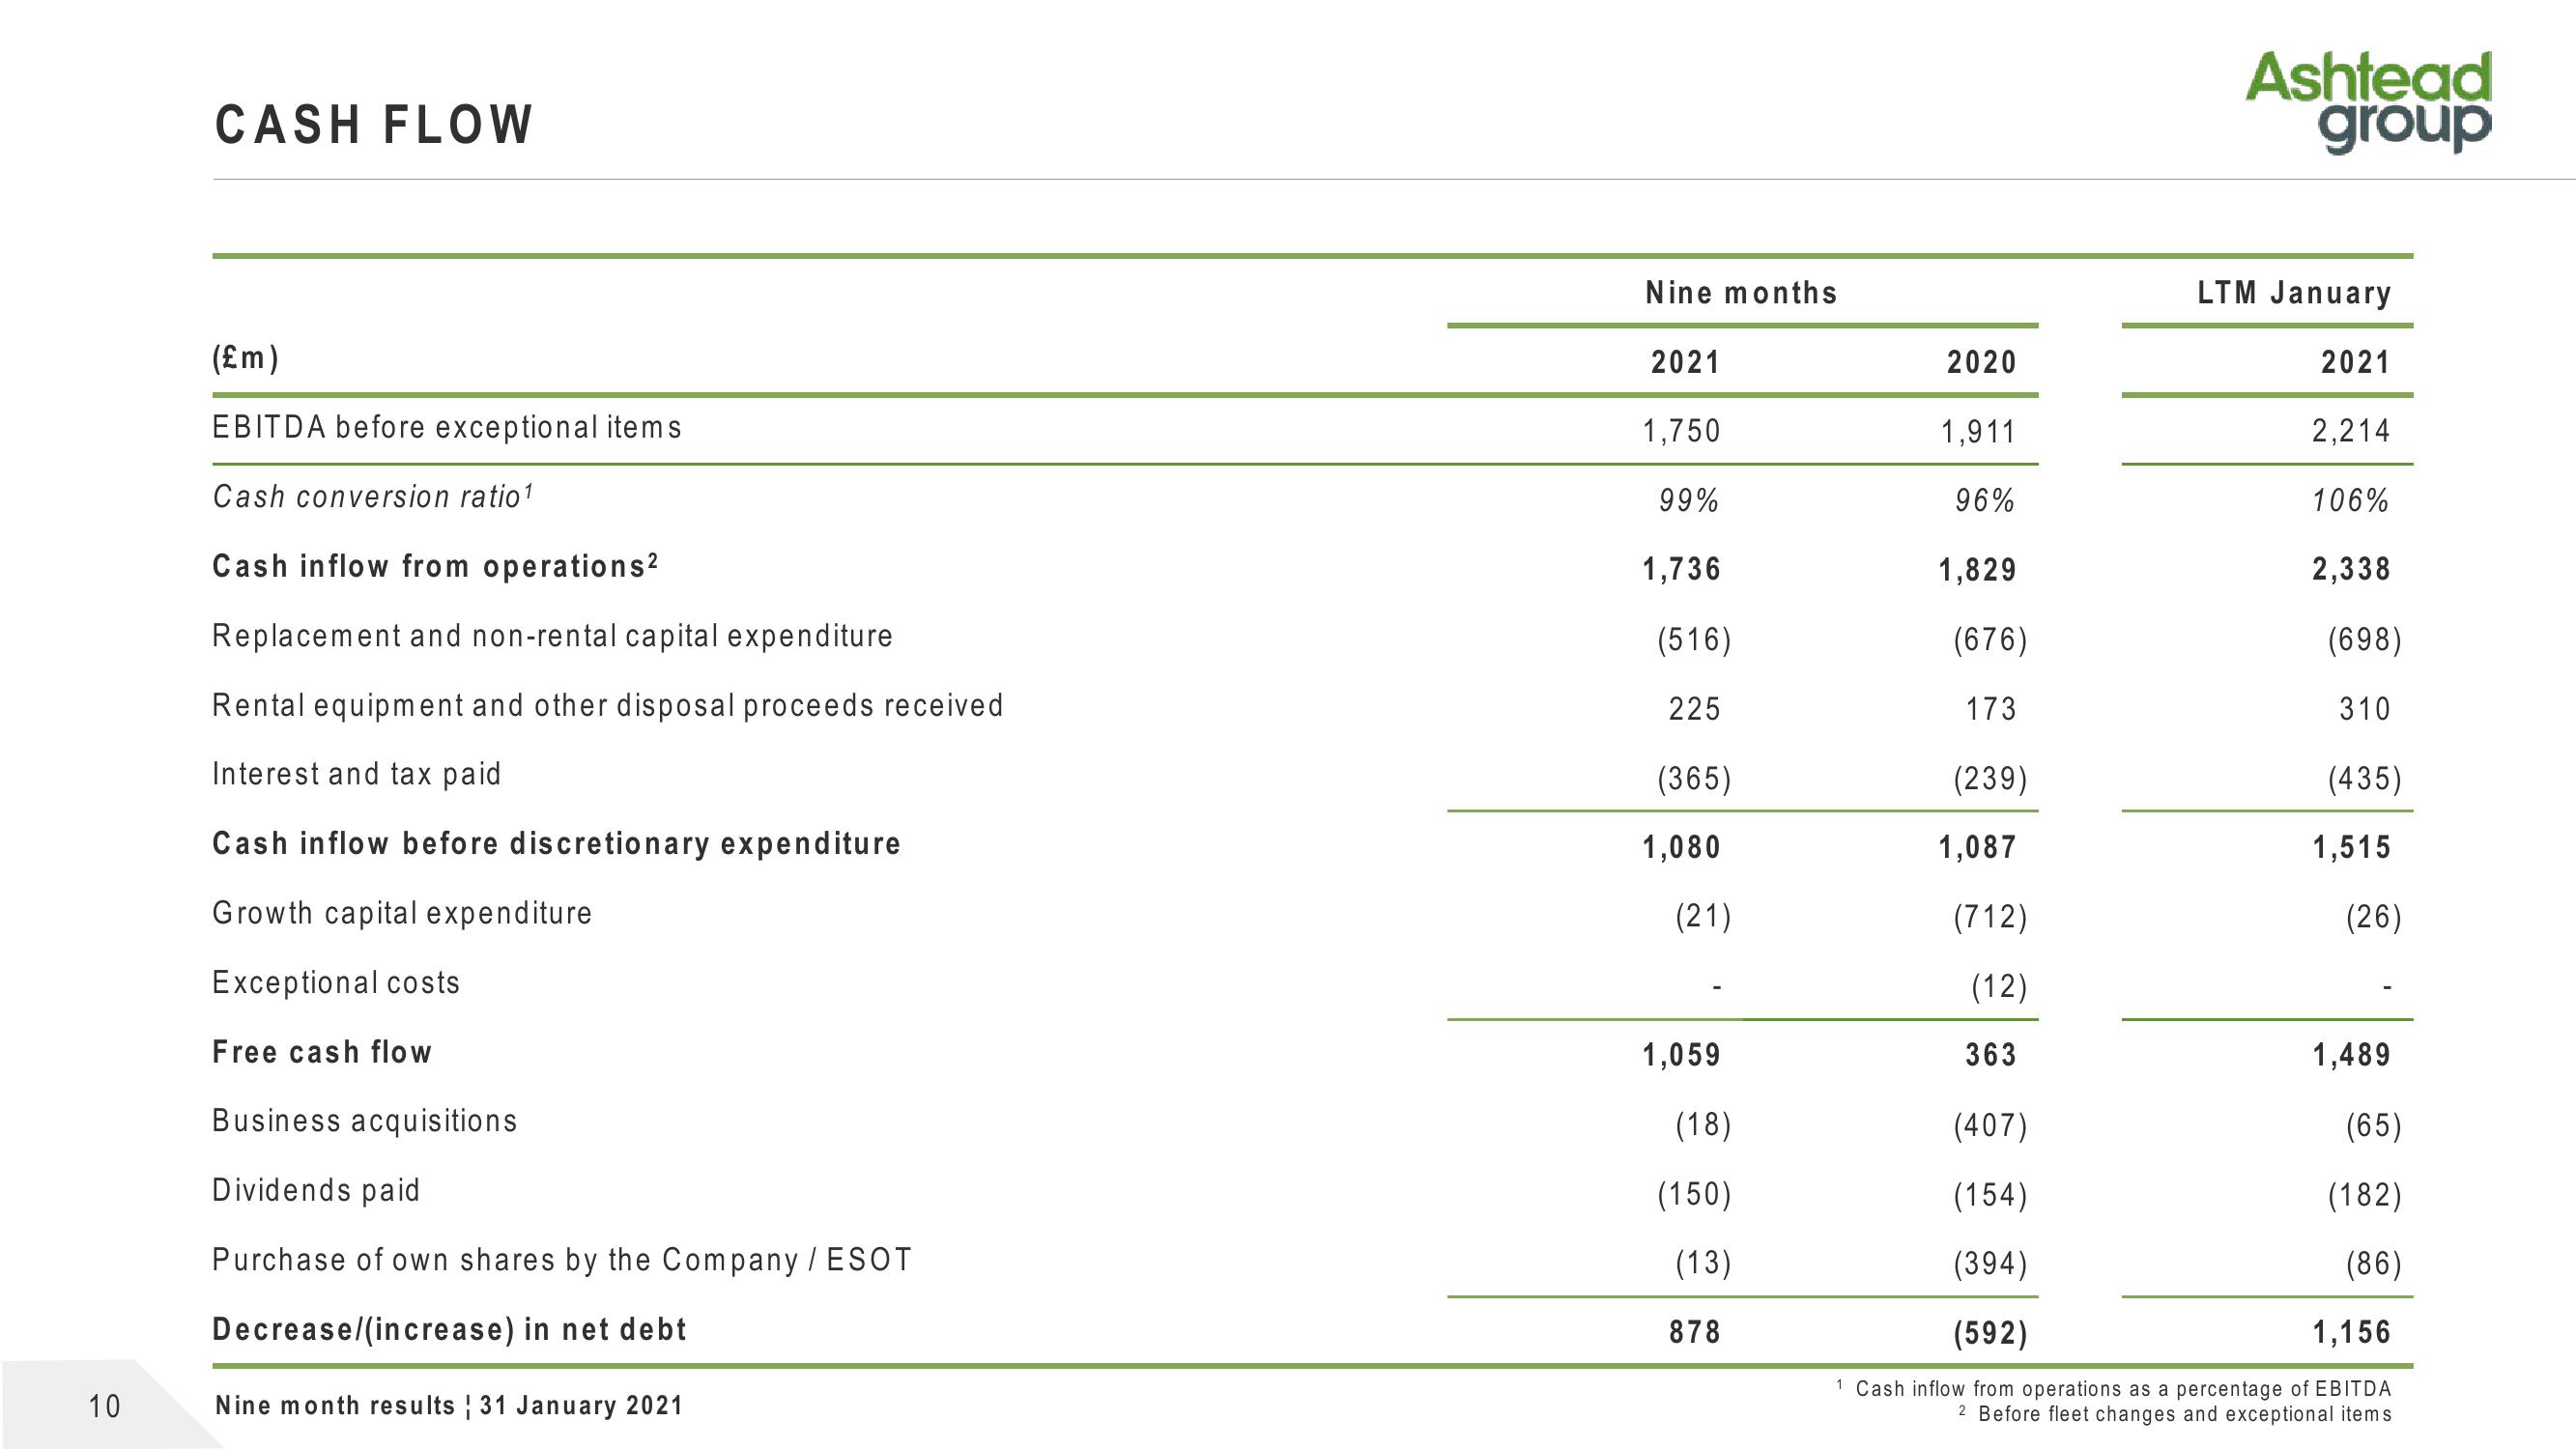
CASH FLOW
(£m)
EBITDA before exceptional items
Cash conversion ratio ¹
Cash inflow from operations²
Replacement and non-rental capital expenditure
Rental equipment and other disposal proceeds received
Interest and tax paid
Cash inflow before discretionary expenditure
Growth capital expenditure
Exceptional costs
Free cash flow
Business acquisitions
Dividends paid
Purchase of own shares by the Company / ESOT
Decrease/(increase) in net debt
Nine month results 31 January 2021
Nine months
2021
1,750
99%
1,736
(516)
225
(365)
1,080
(21)
1,059
(18)
(150)
(13)
878
2020
1,911
96%
1,829
(676)
173
(239)
1,087
Ashtead
group
LTM January
2021
2,214
106%
2,338
(698)
310
(435)
1,515
(712)
(12)
363
(407)
(154)
(394)
(592)
1,156
1 Cash inflow from operations as a percentage of EBITDA
2 Before fleet changes and exceptional items
(26)
1,489
(65)
(182)
(86)View entire presentation