Hanmi Financial Results Presentation Deck
Total Balance
Average
Median
(3)
Top Quintile Balance
Top Quintile Loan Size
Top Quintile Average
Top Quintile Median
Owner
Occupied
$719
$0.94
$0.30
$538
$1.1 or more
$3.54
$2.00
CRE
Investor
Owned
$2,544
$2.85
$1.12
$1,810
$3.3 or more
$10.23
$6.64
Total Balance
Average
Median
($ in millions)
Top Quintile Balance (³)
Top Quintile Loan Size
Top Quintile Average
Top Quintile Median
(1)
Multifamily
Construction
$385
$90
$2.47
$8.96
$1.00
$3.84
$272
$55
$2.4 or more
$23.4 or more
$8.76
$27.50
$4.32
$27.50
Residential Real Estate & Equipment Finance
Loan Portfolio Distribution
Total Balance
Average
Median
Residential Real Estate
$887
$0.52
$0.45
$364
$0.7 or more
$1.09
$0.90
(3)
Top Quintile Balance
Top Quintile Loan Size
Top Quintile Average
Top Quintile Median
Equipment Finance
$586
$0.05
$0.03
$299
$0.1 or more
$0.12
$0.10
C&I
(2)
Term
$372
$0.37
$0.05
$336
$0.1 or more
$1.7
$0.23
($ in millions)
Lines of Credit
$381
$0.68
$0.06
$329
$0.8 or more
$4.21
$1.75
(2)
($ in millions)
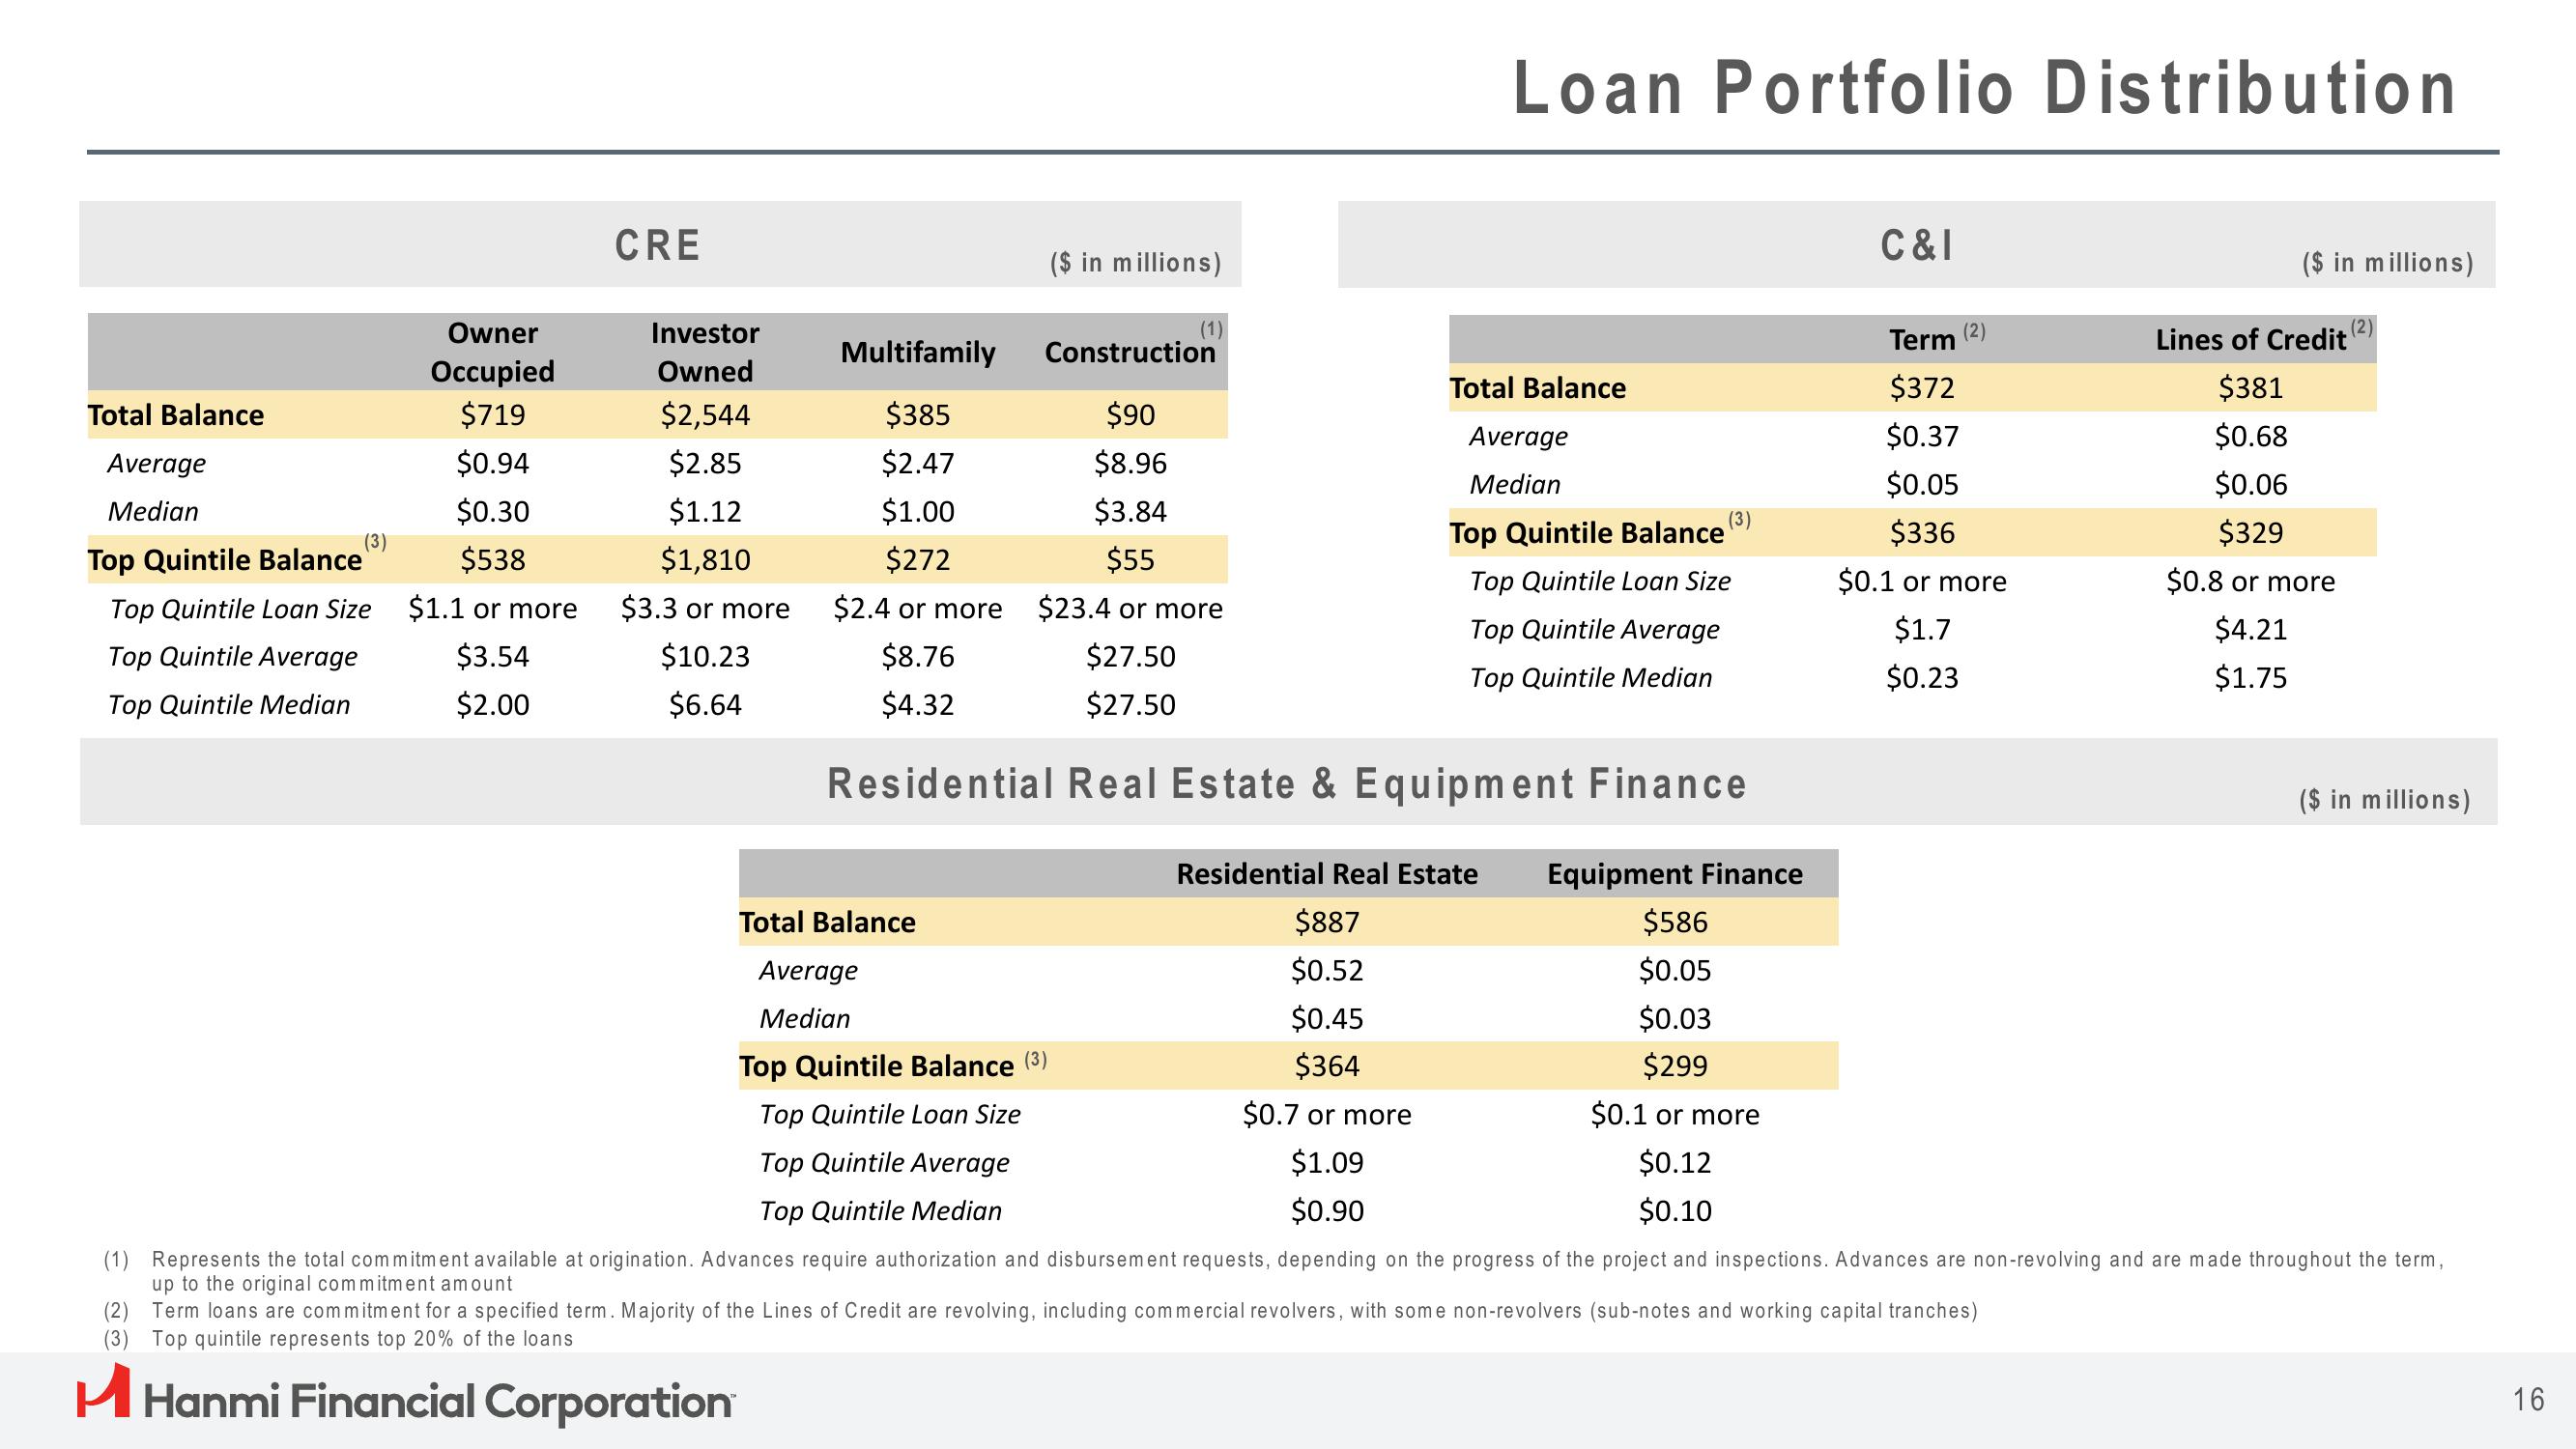
(1) Represents the total commitment available at origination. Advances require authorization and disbursement requests, depending on the progress of the project and inspections. Advances are non-revolving and are made throughout the term,
up to the original commitment amount
(2) Term loans are commitment for a specified term. Majority of the Lines of Credit are revolving, including commercial revolvers, with some non-revolvers (sub-notes and working capital tranches)
(3) Top quintile represents top 20% of the loans
H Hanmi Financial Corporation
16View entire presentation