Solar Industry Update
10
8
00
6
st
N
U.S. Installation Breakdown
Quarterly: SEIA (GWdc)
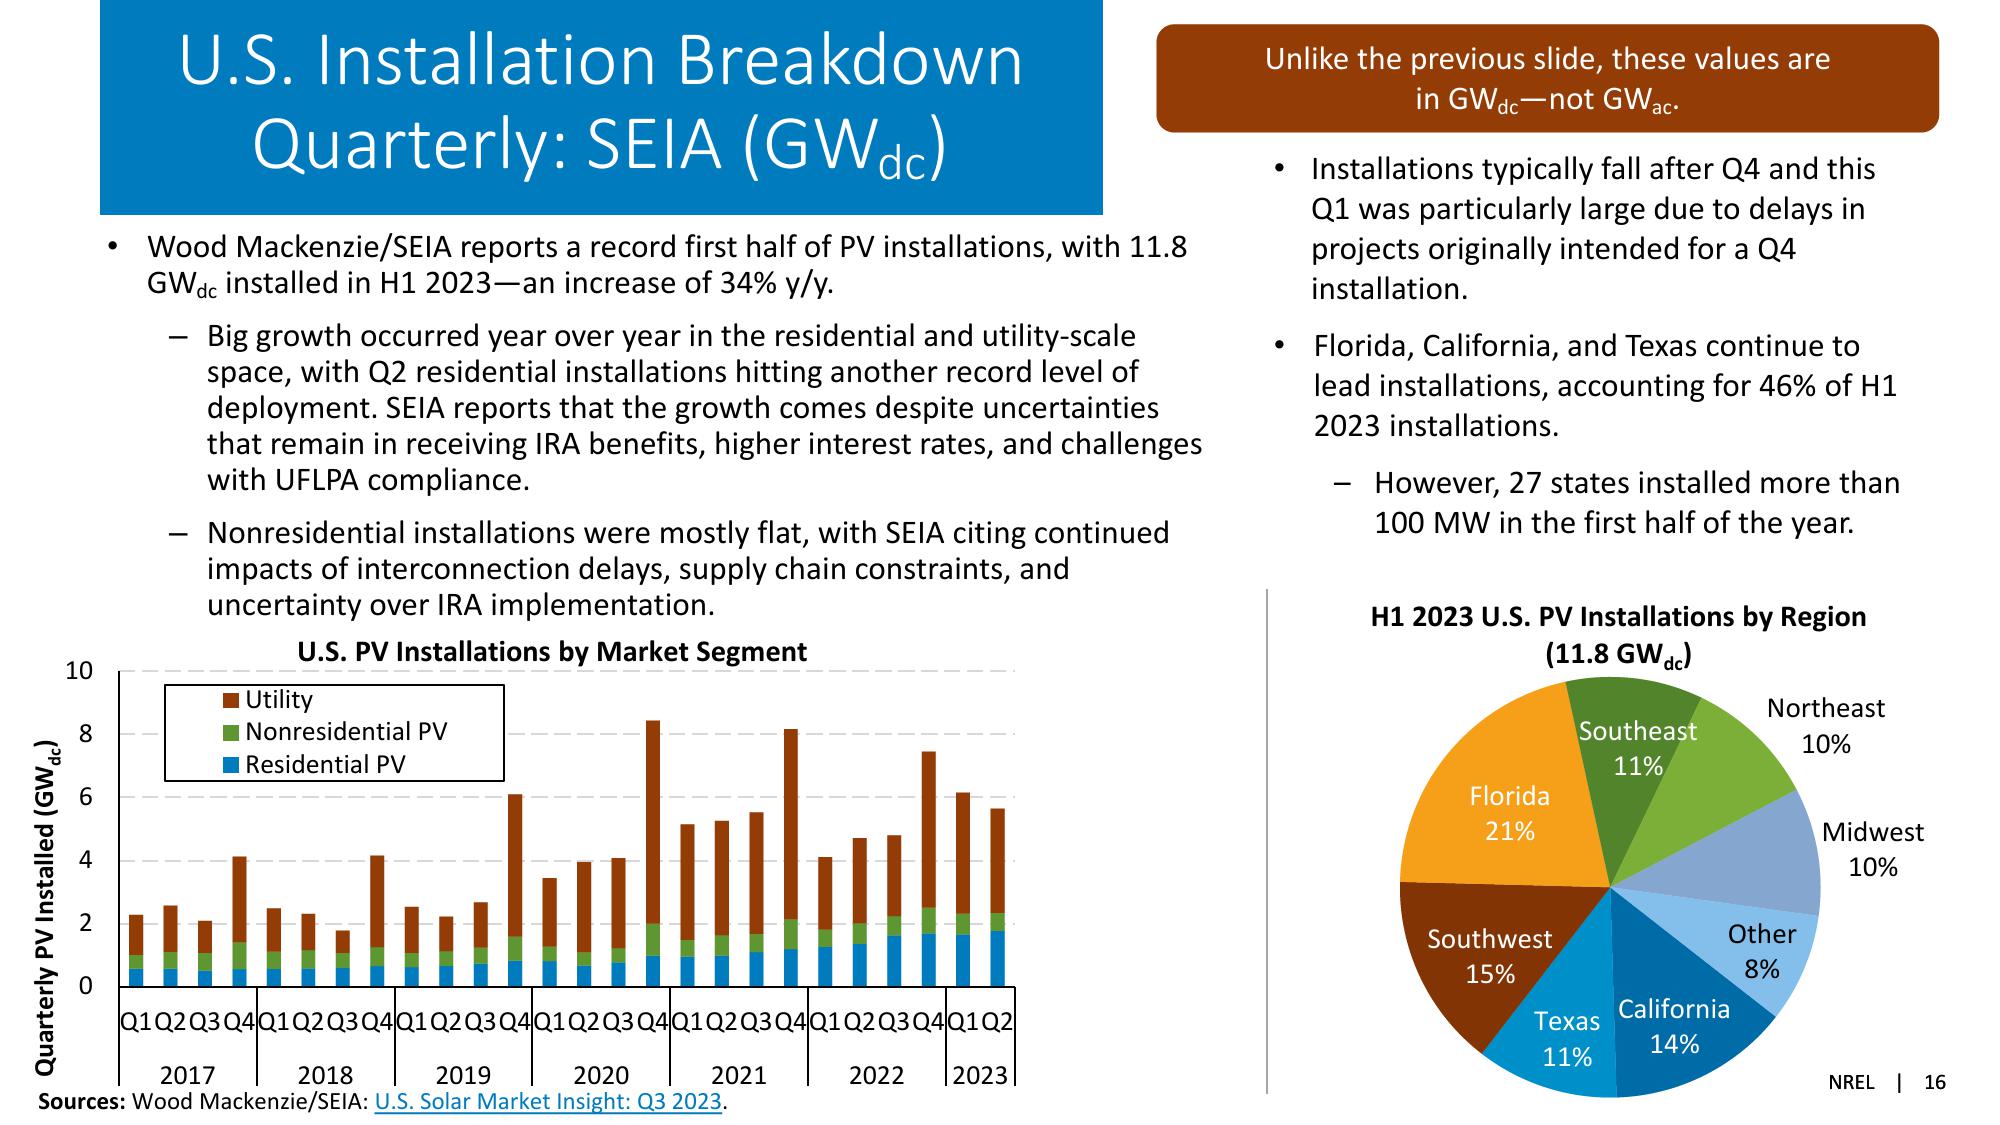
Wood Mackenzie/SEIA reports a record first half of PV installations, with 11.8
GWdc installed in H1 2023-an increase of 34% y/y.
-
Big growth occurred year over year in the residential and utility-scale
space, with Q2 residential installations hitting another record level of
deployment. SEIA reports that the growth comes despite uncertainties
that remain in receiving IRA benefits, higher interest rates, and challenges
with UFLPA compliance.
Nonresidential installations were mostly flat, with SEIA citing continued
impacts of interconnection delays, supply chain constraints, and
uncertainty over IRA implementation.
U.S. PV Installations by Market Segment
Utility
| Nonresidential PV
Residential PV
Unlike the previous slide, these values are
•
in GWdc-not GWac.
Installations typically fall after Q4 and this
Q1 was particularly large due to delays in
projects originally intended for a Q4
installation.
Florida, California, and Texas continue to
lead installations, accounting for 46% of H1
2023 installations.
-
However, 27 states installed more than
100 MW in the first half of the year.
H1 2023 U.S. PV Installations by Region
(11.8 GWdc)
Southeast
11%
Northeast
10%
Florida
21%
Quarterly PV Installed (GWdc)
Q1Q2 Q3 Q4Q1 Q2 Q3 Q4 Q1 Q2 Q3 Q4 Q1 Q2 Q3 Q4Q1 Q2 Q3 Q4 Q1 Q2 Q3 Q4 Q1 Q2
2017
2018
2019
2020
2021
Sources: Wood Mackenzie/SEIA: U.S. Solar Market Insight: Q3 2023.
2022
2023
Southwest
15%
Other
8%
Midwest
10%
California
Texas
11%
14%
NREL 16View entire presentation