Q2 FY24 Earnings Presentation
Q2FY23
GAAP
($ in Millions, except for EPS)
Intangible
Amortization
Stock-based
compensation
expense
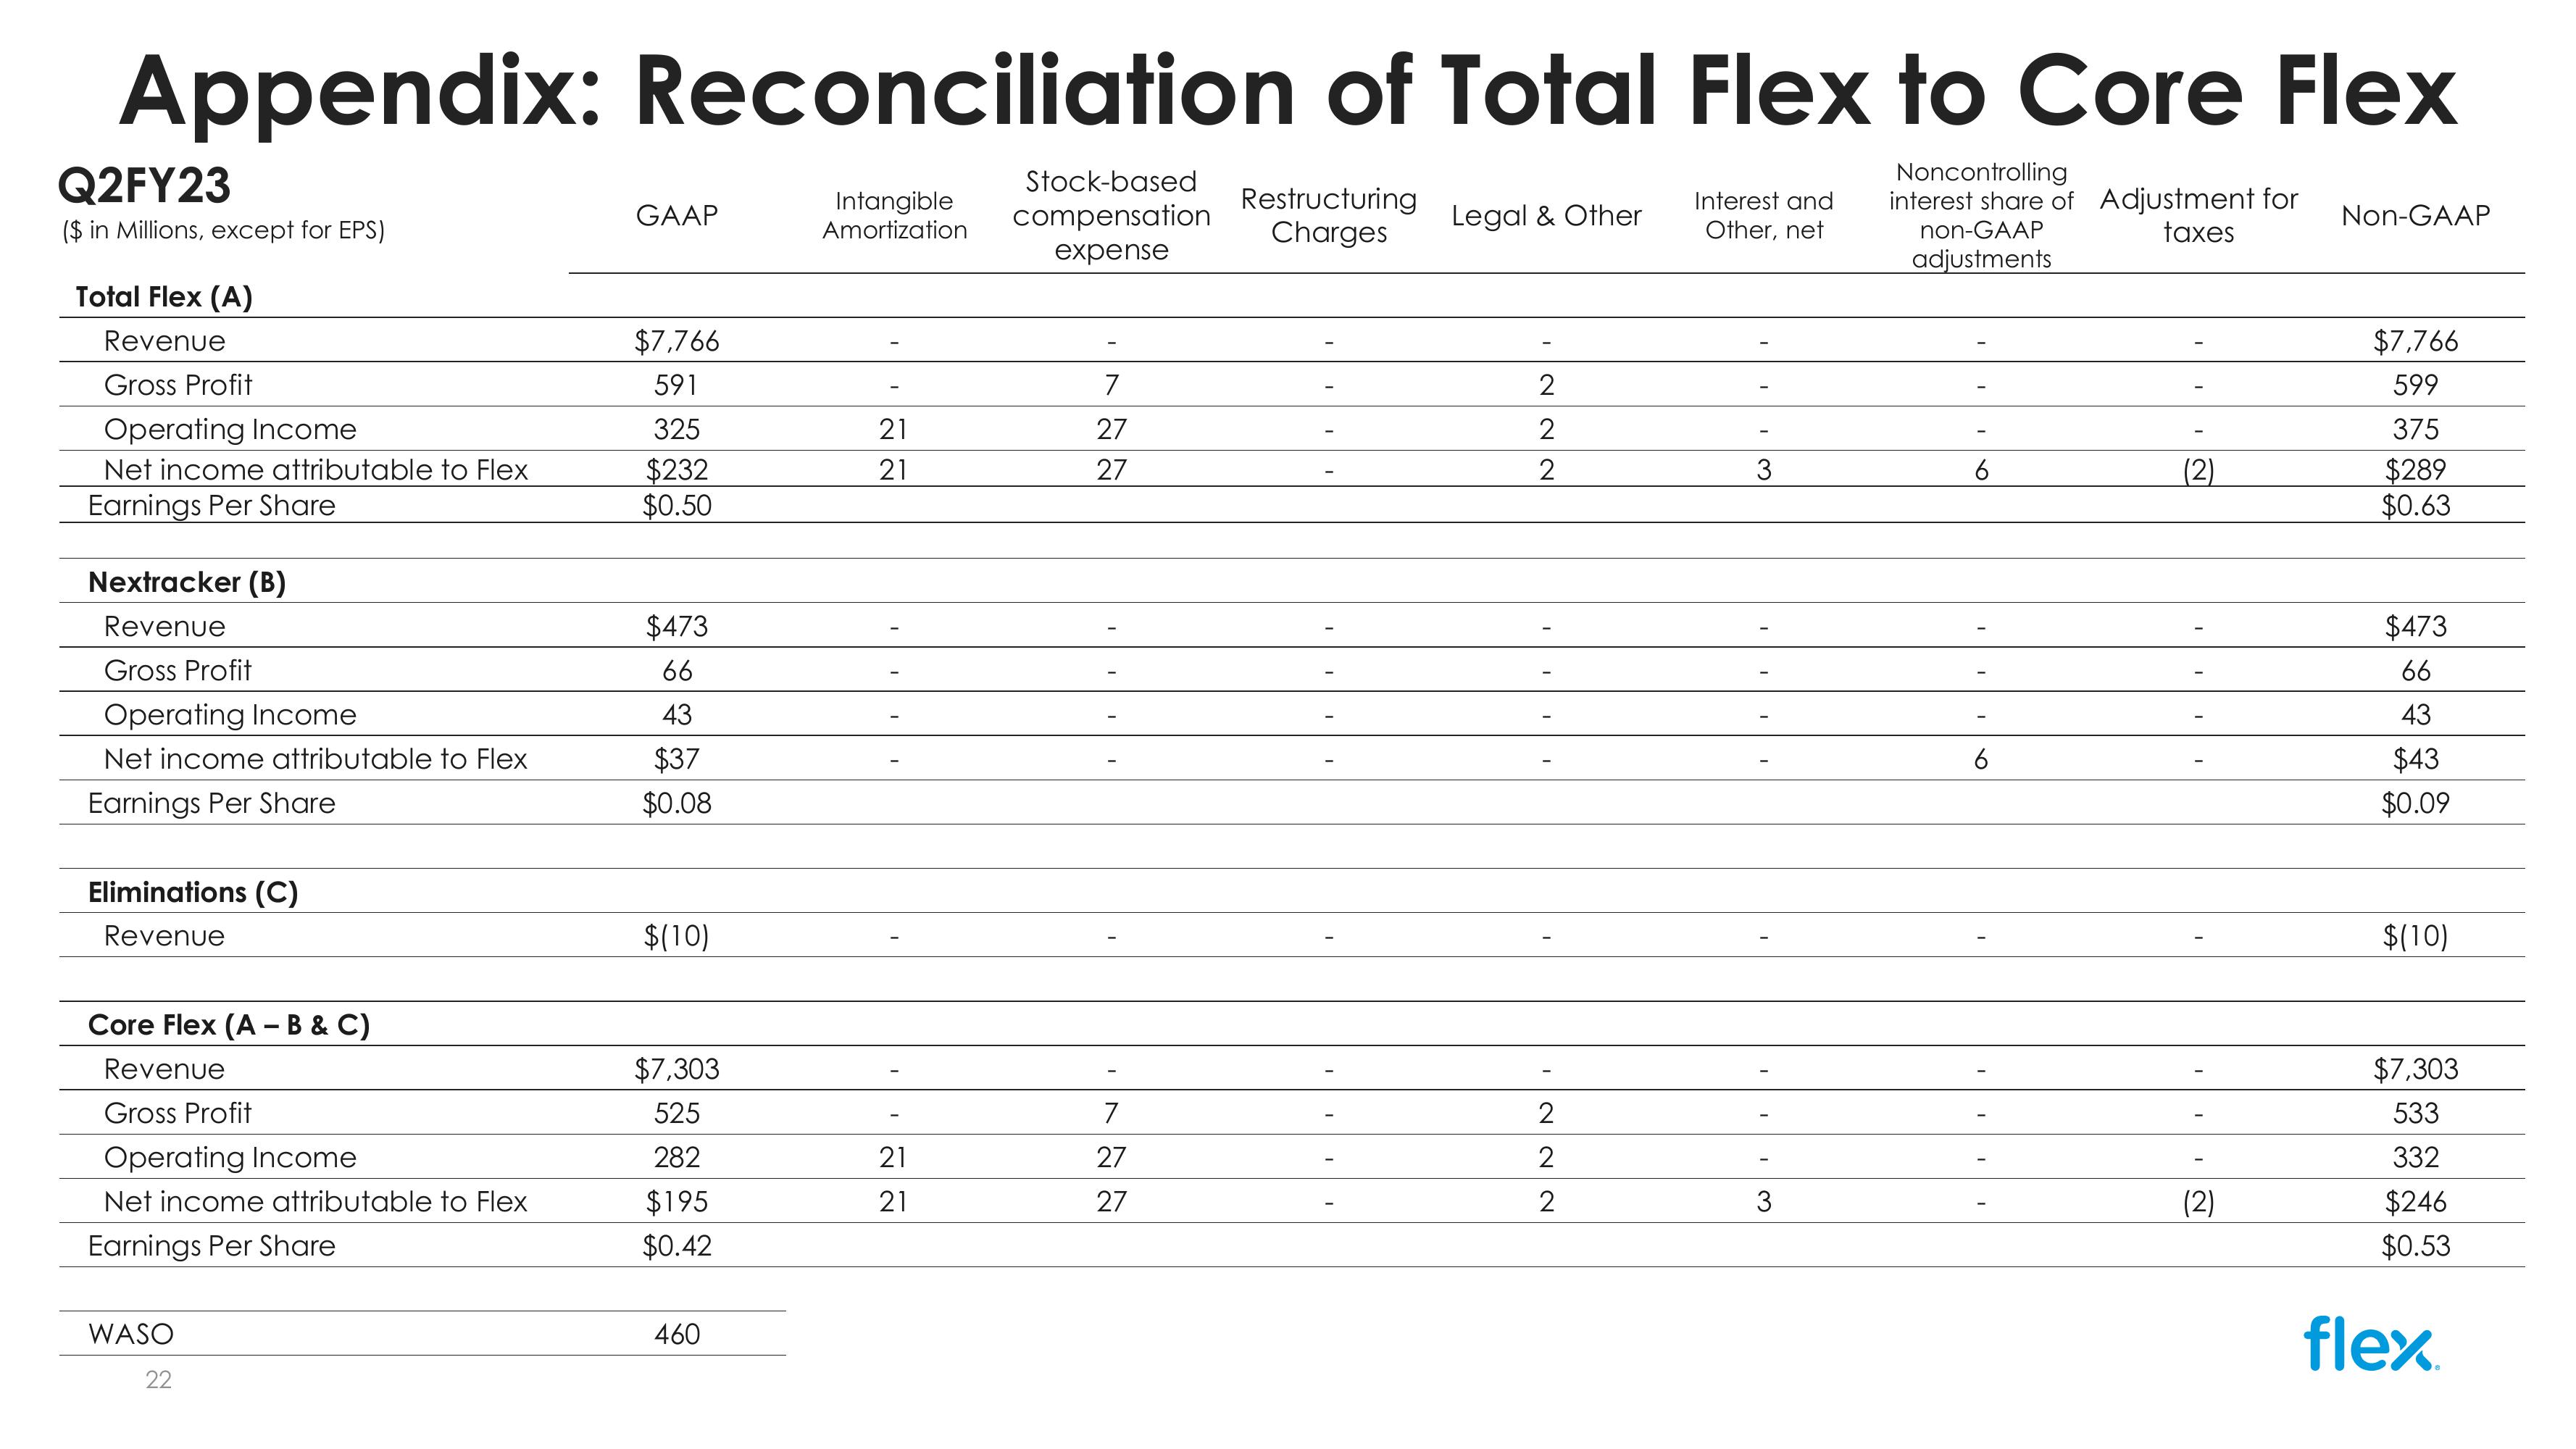
Appendix: Reconciliation of Total Flex to Core Flex
Noncontrolling
interest share of Adjustment for
taxes
non-GAAP
adjustments
Non-GAAP
Restructuring
Charges
Legal & Other
Interest and
Other, net
Total Flex (A)
Revenue
$7,766
$7,766
Gross Profit
591
7
Operating Income
325
21
27
22
2
599
375
Net income attributable to Flex
$232
21
27
2
3
6
(2)
$289
Earnings Per Share
$0.50
$0.63
Nextracker (B)
Revenue
$473
Gross Profit
66
Operating Income
43
Net income attributable to Flex
$37
Earnings Per Share
$0.08
$473
66
43
6
$43
$0.09
Eliminations (C)
Revenue
$(10)
$(10)
Core Flex (A-B & C)
Revenue
$7,303
I
$7,303
Gross Profit
525
7
2
533
Operating Income
282
21
27
2
332
Net income attributable to Flex
$195
21
27
2
3
(2)
$246
Earnings Per Share
$0.42
$0.53
WASO
22
460
flexView entire presentation