Deutsche Bank Results Presentation Deck
Q1 2023 highlights
In € bn, unless stated otherwise
Financial results
Statement of income
Revenues
Revenues ex-specific items¹
Provision for credit losses
Noninterest expenses
Adjusted costs
Pre-provision profit
Profit (loss) before tax
Profit (loss)
Balance sheet and resources
Average interest earning assets
Loans²
Deposits
Risk-weighted assets
Leverage exposure³
Performance measures and ratios
ROTE
Cost/income ratio
Provision for credit losses, bps of avg. loans4
CET1 ratio
Leverage ratio³
Per share information
Diluted earnings per share
TBV per basic share outstanding
Note: for footnotes refer to slides 45 and 46
Deutsche Bank
Investor Relations
Q1 2023
7.7
7.6
0.4
5.5
5.4
2.2
1.9
1.3
972
488
592
360
1,238
8.3%
71%
30
13.6%
4.6%
€ 0.61
€ 27.28
A vs.
Q1 2022
5%
4%
27%
1%
(0)%
14%
12%
8%
1%
1%
(2)%
(1)%
(1)%
(2)ppt
6bps
80bps
36bps
10%
8%
A vs.
Q4 2022
Q1 2023 results
April 27, 2023
22%
26%
0.2ppt (4.8)ppt
(11)ppt
6%
5%
10%
98%
139%
(33)%
(2)%
(0)%
(5)%
(0)%
(0)%
2bps
25bps
6bps
(33)%
2%
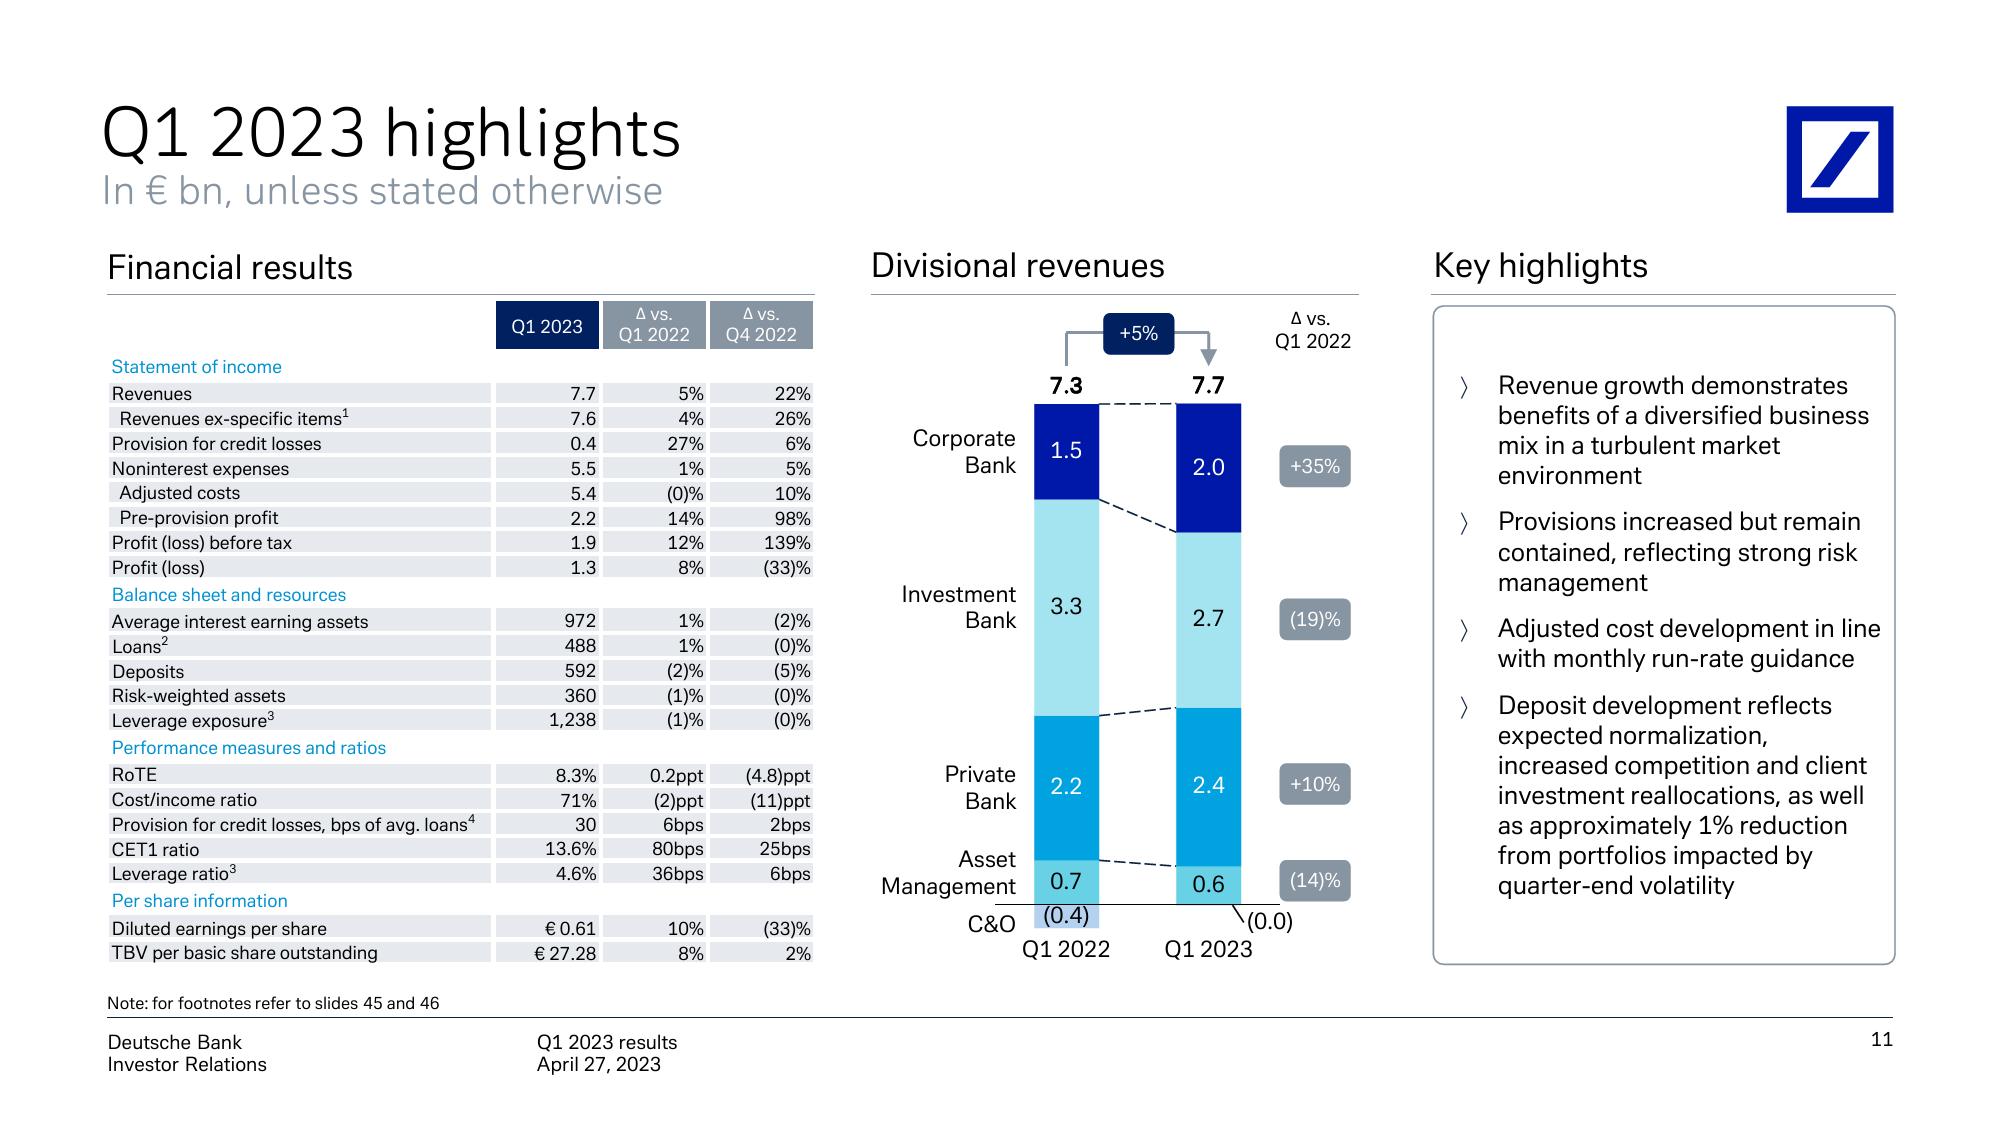
Divisional revenues
Corporate
Bank
Investment
Bank
Private
Bank
7.3
1.5
3.3
2.2
Asset
Management 0.7
C&O (0.4)
Q1 2022
+5%
7.7
2.0
2.7
2.4
0.6
A vs.
Q1 2022
Q1 2023
+35%
(19)%
+10%
(14)%
(0.0)
Key highlights
>
/
Revenue growth demonstrates
benefits of a diversified business
mix in a turbulent market
environment
> Provisions increased but remain
contained, reflecting strong risk
management
> Adjusted cost development in line
with monthly run-rate guidance
> Deposit development reflects
expected normalization,
increased competition and client
investment reallocations, as well
as approximately 1% reduction
from portfolios impacted by
quarter-end volatility
11View entire presentation