AstraZeneca Results Presentation Deck
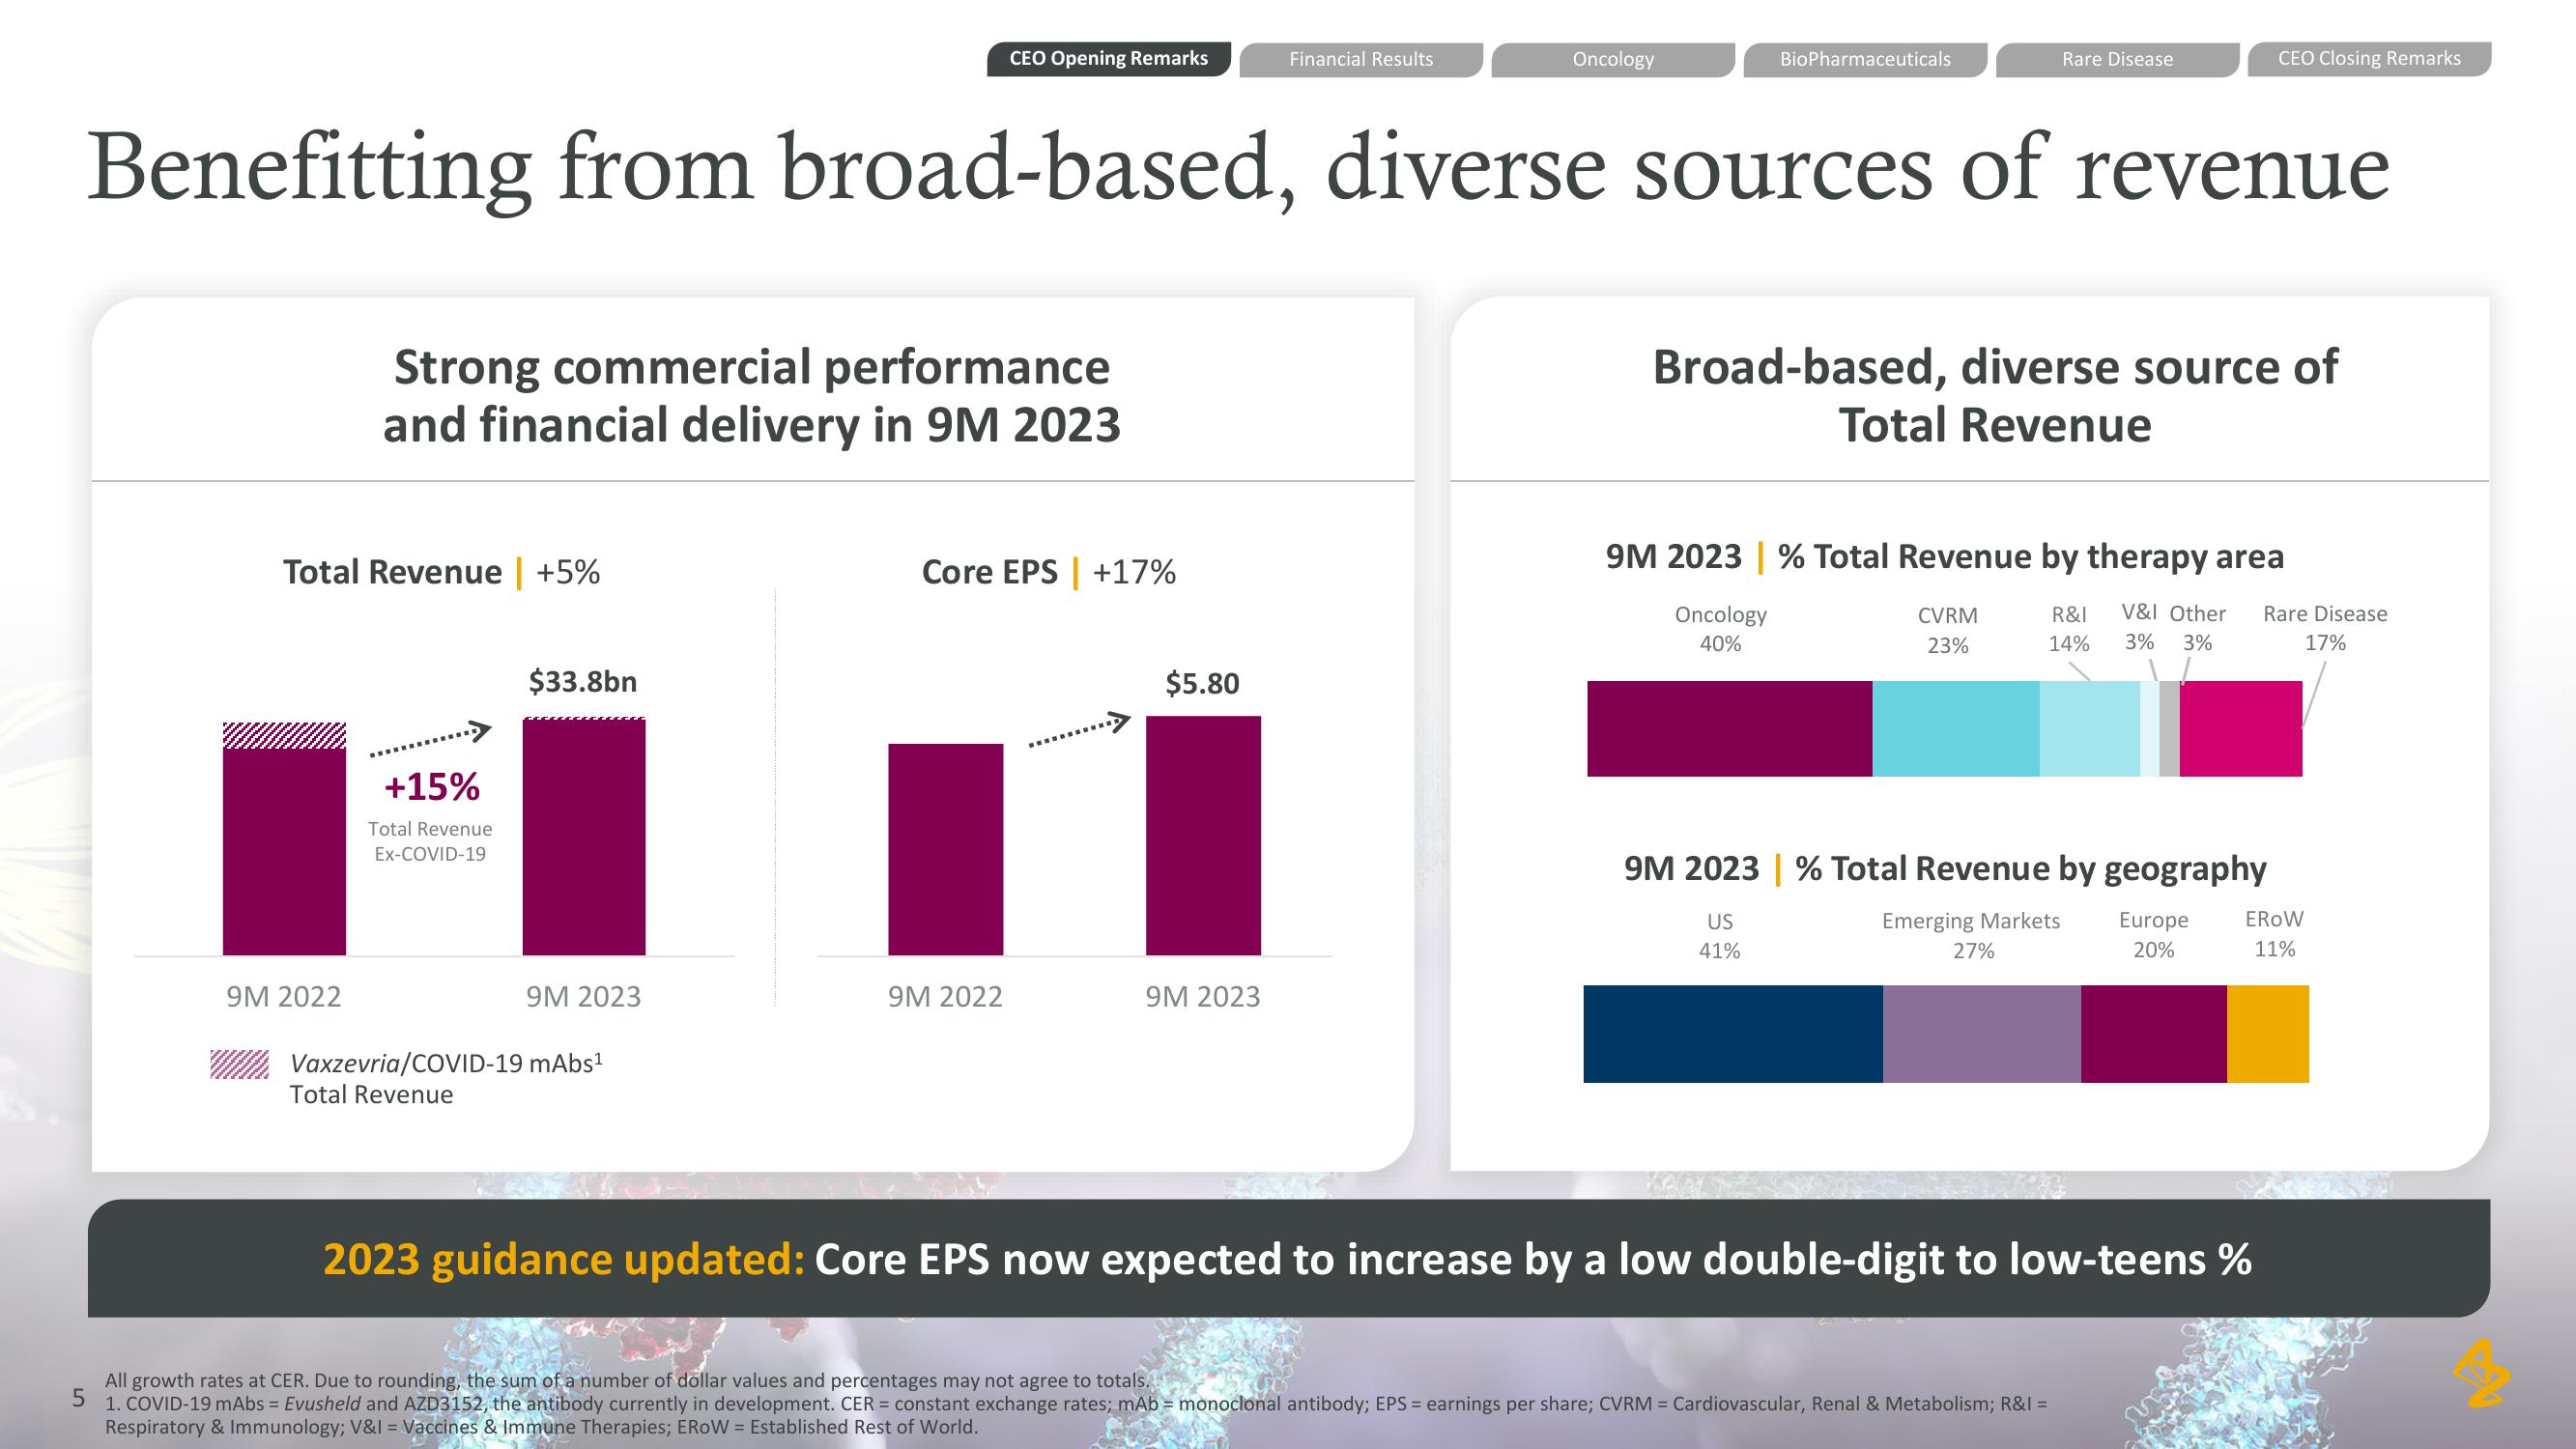
Total Revenue | +5%
9M 2022
Strong commercial performance
and financial delivery in 9M 2023
+15%
Total Revenue
Ex-COVID-19
$33.8bn
Benefitting from broad-based, diverse sources of revenue
9M 2023
CEO Opening Remarks
Vaxzevria/COVID-19 mAbs¹
Total Revenue
Core EPS +17%
9M 2022
$5.80
Financial Results
9M 2023
Oncology
BioPharmaceuticals
Oncology
40%
Broad-based, diverse source of
Total Revenue
Rare Disease
9M 2023 % Total Revenue by therapy area
R&I V&I Other
14% 3% 3%
CVRM
23%
27%
CEO Closing Remarks
9M 2023 % Total Revenue by geography
US
Emerging Markets Europe
41%
20%
All growth rates at CER. Due to rounding, the sum of a number of dollar values and percentages may not agree to totals.
5 1. COVID-19 mAbs = Evusheld and AZD3152, the antibody currently in development. CER = constant exchange rates; mAb = monoclonal antibody; EPS = earnings per share; CVRM = Cardiovascular, Renal & Metabolism; R&I=
Respiratory & Immunology; V&I = Vaccines & Immune Therapies; EROW = Established Rest of World.
2023 guidance updated: Core EPS now expected to increase by a low double-digit to low-teens %
Rare Disease
17%
EROW
11%View entire presentation