AstraZeneca Investor Day Presentation Deck
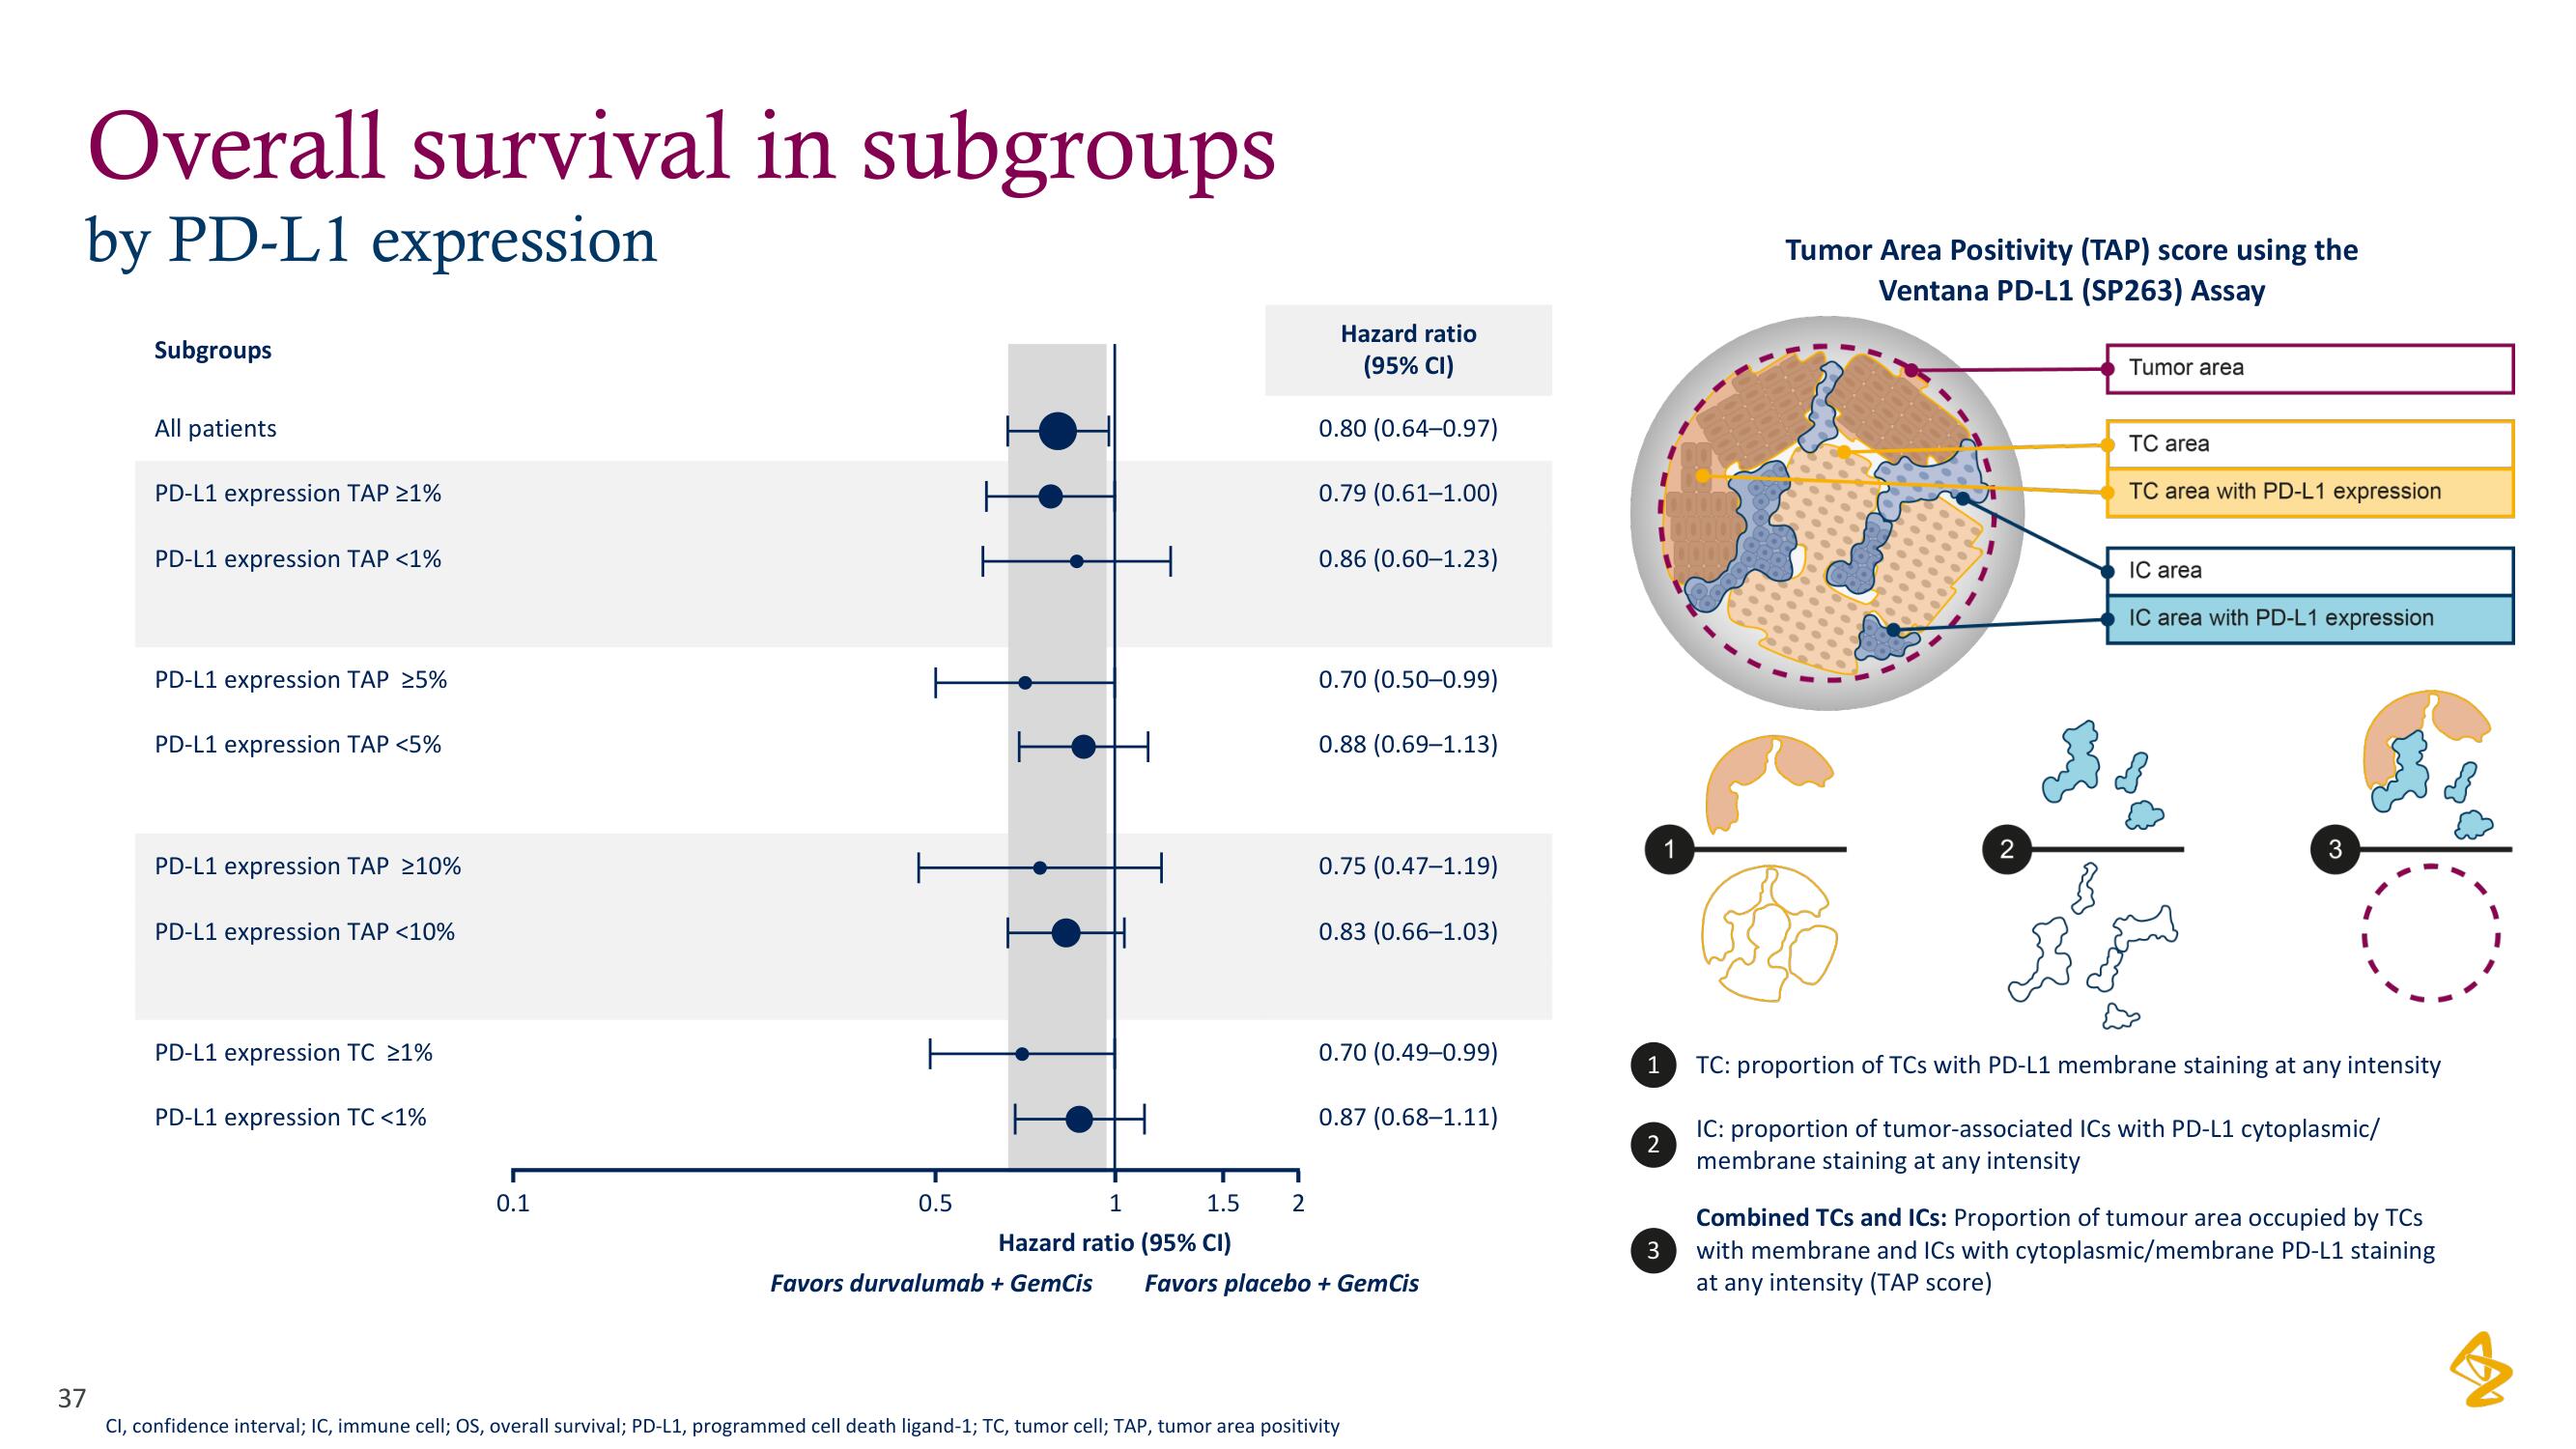
Overall survival in subgroups
by PD-L1 expression
Subgroups
All patients
PD-L1 expression TAP >1%
PD-L1 expression TAP <1%
PD-L1 expression TAP 25%
PD-L1 expression TAP <5%
PD-L1 expression TAP >10%
PD-L1 expression TAP <10%
PD-L1 expression TC >1%
PD-L1 expression TC <1%
0.1
0.5
Hazard ratio
(95% CI)
0.80 (0.64-0.97)
0.79 (0.61-1.00)
0.86 (0.60-1.23)
2
0.70 (0.50-0.99)
0.88 (0.69-1.13)
0.75 (0.47-1.19)
0.83 (0.66-1.03)
1
1.5
Hazard ratio (95% CI)
Favors durvalumab + GemCis Favors placebo + GemCis
0.70 (0.49-0.99)
0.87 (0.68-1.11)
37
CI, confidence interval; IC, immune cell; OS, overall survival; PD-L1, programmed cell death ligand-1; TC, tumor cell; TAP, tumor area positivity
1
2
3
1
Tumor Area Positivity (TAP) score using the
Ventana PD-L1 (SP263) Assay
Tumor area
TC area
TC area with PD-L1 expression
IC area
IC area with PD-L1 expression
3
TC: proportion of TCs with PD-L1 membrane staining at any intensity
IC: proportion of tumor-associated ICs with PD-L1 cytoplasmic/
membrane staining at any intensity
Combined TCs and ICs: Proportion of tumour area occupied by TCs
with membrane and ICs with cytoplasmic/membrane PD-L1 staining
at any intensity (TAP score)View entire presentation