Morgan Stanley Investment Banking Pitch Book
●
Project Roosevelt
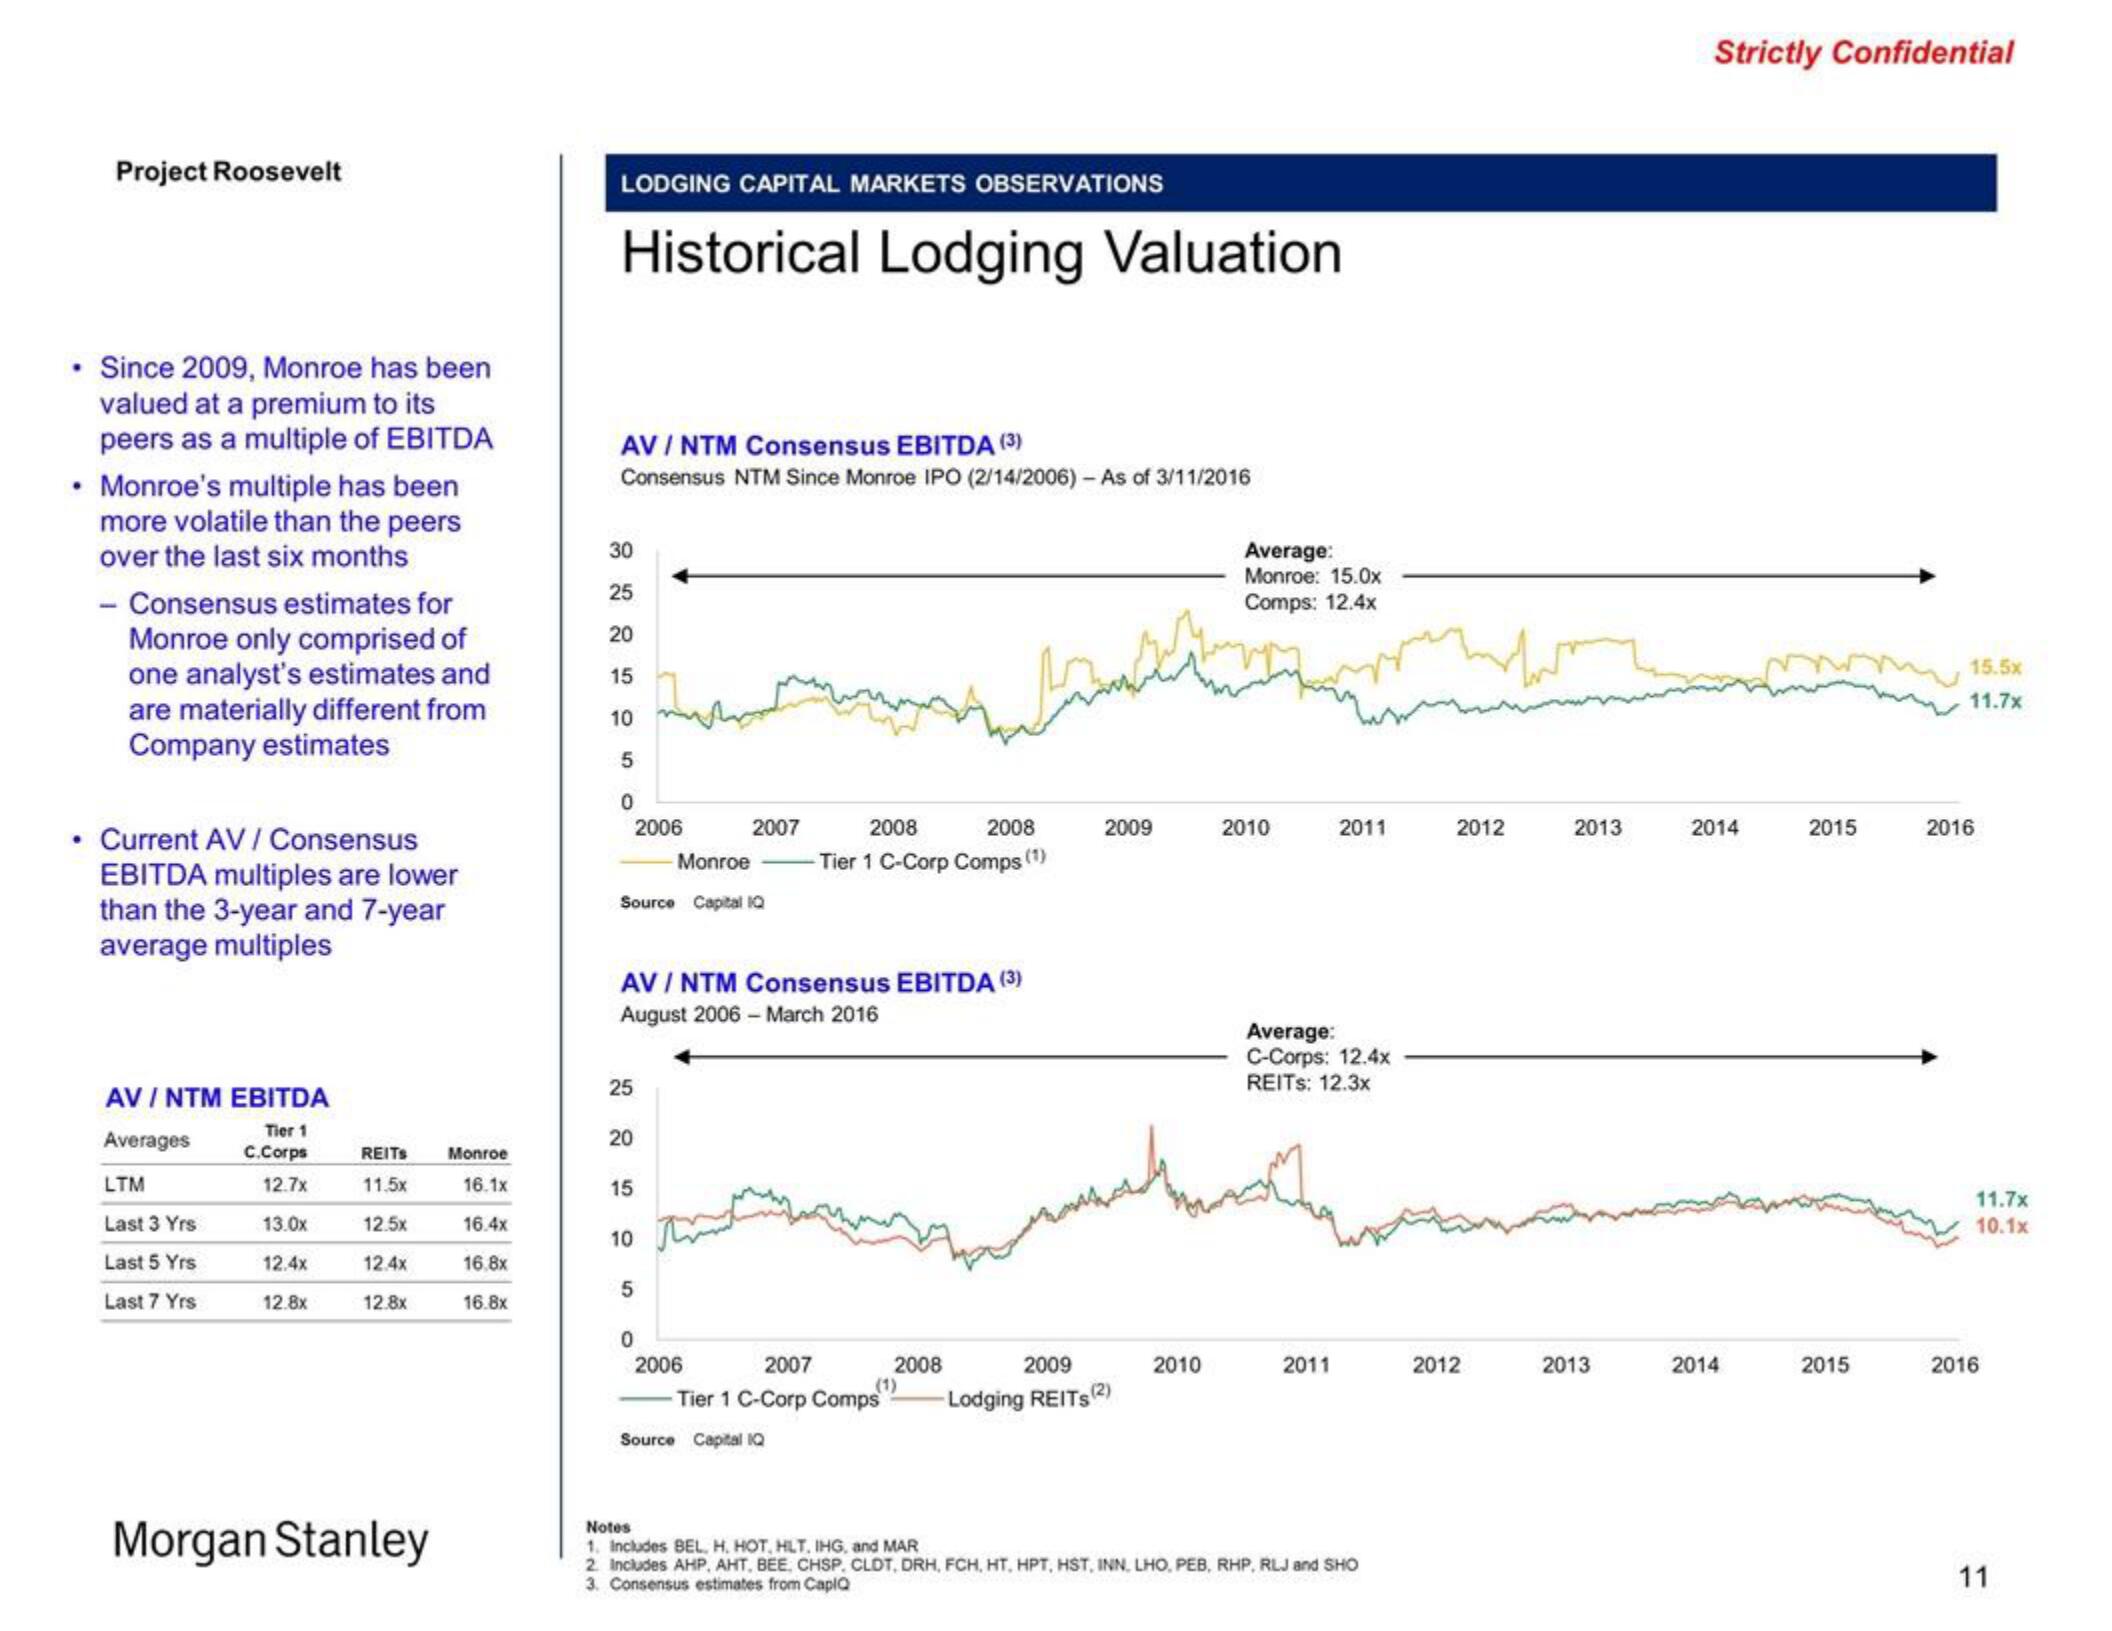
Since 2009, Monroe has been
valued at a premium to its
peers as a multiple of EBITDA
Monroe's multiple has been
more volatile than the peers
over the last six months
- Consensus estimates for
Monroe only comprised of
one analyst's estimates and
are materially different from
Company estimates
• Current AV / Consensus
EBITDA multiples are lower
than the 3-year and 7-year
average multiples
AV / NTM EBITDA
Tier 1
C.Corps
Averages
LTM
12.7x
Last 3 Yrs
13.0x
Last 5 Yrs
12.4x
Last 7 Yrs
12.8x
REITS
11.5x
12.5x
12.4x
12.8x
Morgan Stanley
Monroe
16.1x
16.4x
16.8x
16.8x
LODGING CAPITAL MARKETS OBSERVATIONS
Historical Lodging Valuation
AV / NTM Consensus EBITDA (3)
Consensus NTM Since Monroe IPO (2/14/2006) - As of 3/11/2016
30
25
20
15
10
5
0
Monroe
Source Capital IQ
25
2006
20
15
AV / NTM Consensus EBITDA (3)
August 2006 - March 2016
10
5
2007
0
2006
2007
-Tier 1 C-Corp Comps
2008
2008
-Tier 1 C-Corp Comps (¹)
Source Capital IQ
تا یا سنترال
2008
2009
2009
-Lodging REITS (2)
2010
Average:
Monroe: 15.0x
Comps: 12.4x
2010
2011
Average:
C-Corps: 12.4x
REITS: 12.3x
2011
Notes
1. Includes BEL, H, HOT, HLT, IHG, and MAR
2. Includes AHP, AHT, BEE, CHSP, CLDT, DRH, FCH, HT, HPT, HST, INN, LHO, PEB, RHP, RLJ and SHO
3. Consensus estimates from CaplQ
2012
2012
2013
2013
Strictly Confidential
2014
2014
2015
2015
15.57
11.7x
2016
11.7x
10.1x
2016
11View entire presentation