Goldman Sachs Investment Banking Pitch Book
Goldman
Sachs
Summary
Total Revenue
% Growth
Adjusted EBITDA (Unburdened by SBC)
(-) Stock-Based Compensation
Adjusted EBITDA (Burdened by SBC)
% Margin
(-) D&A
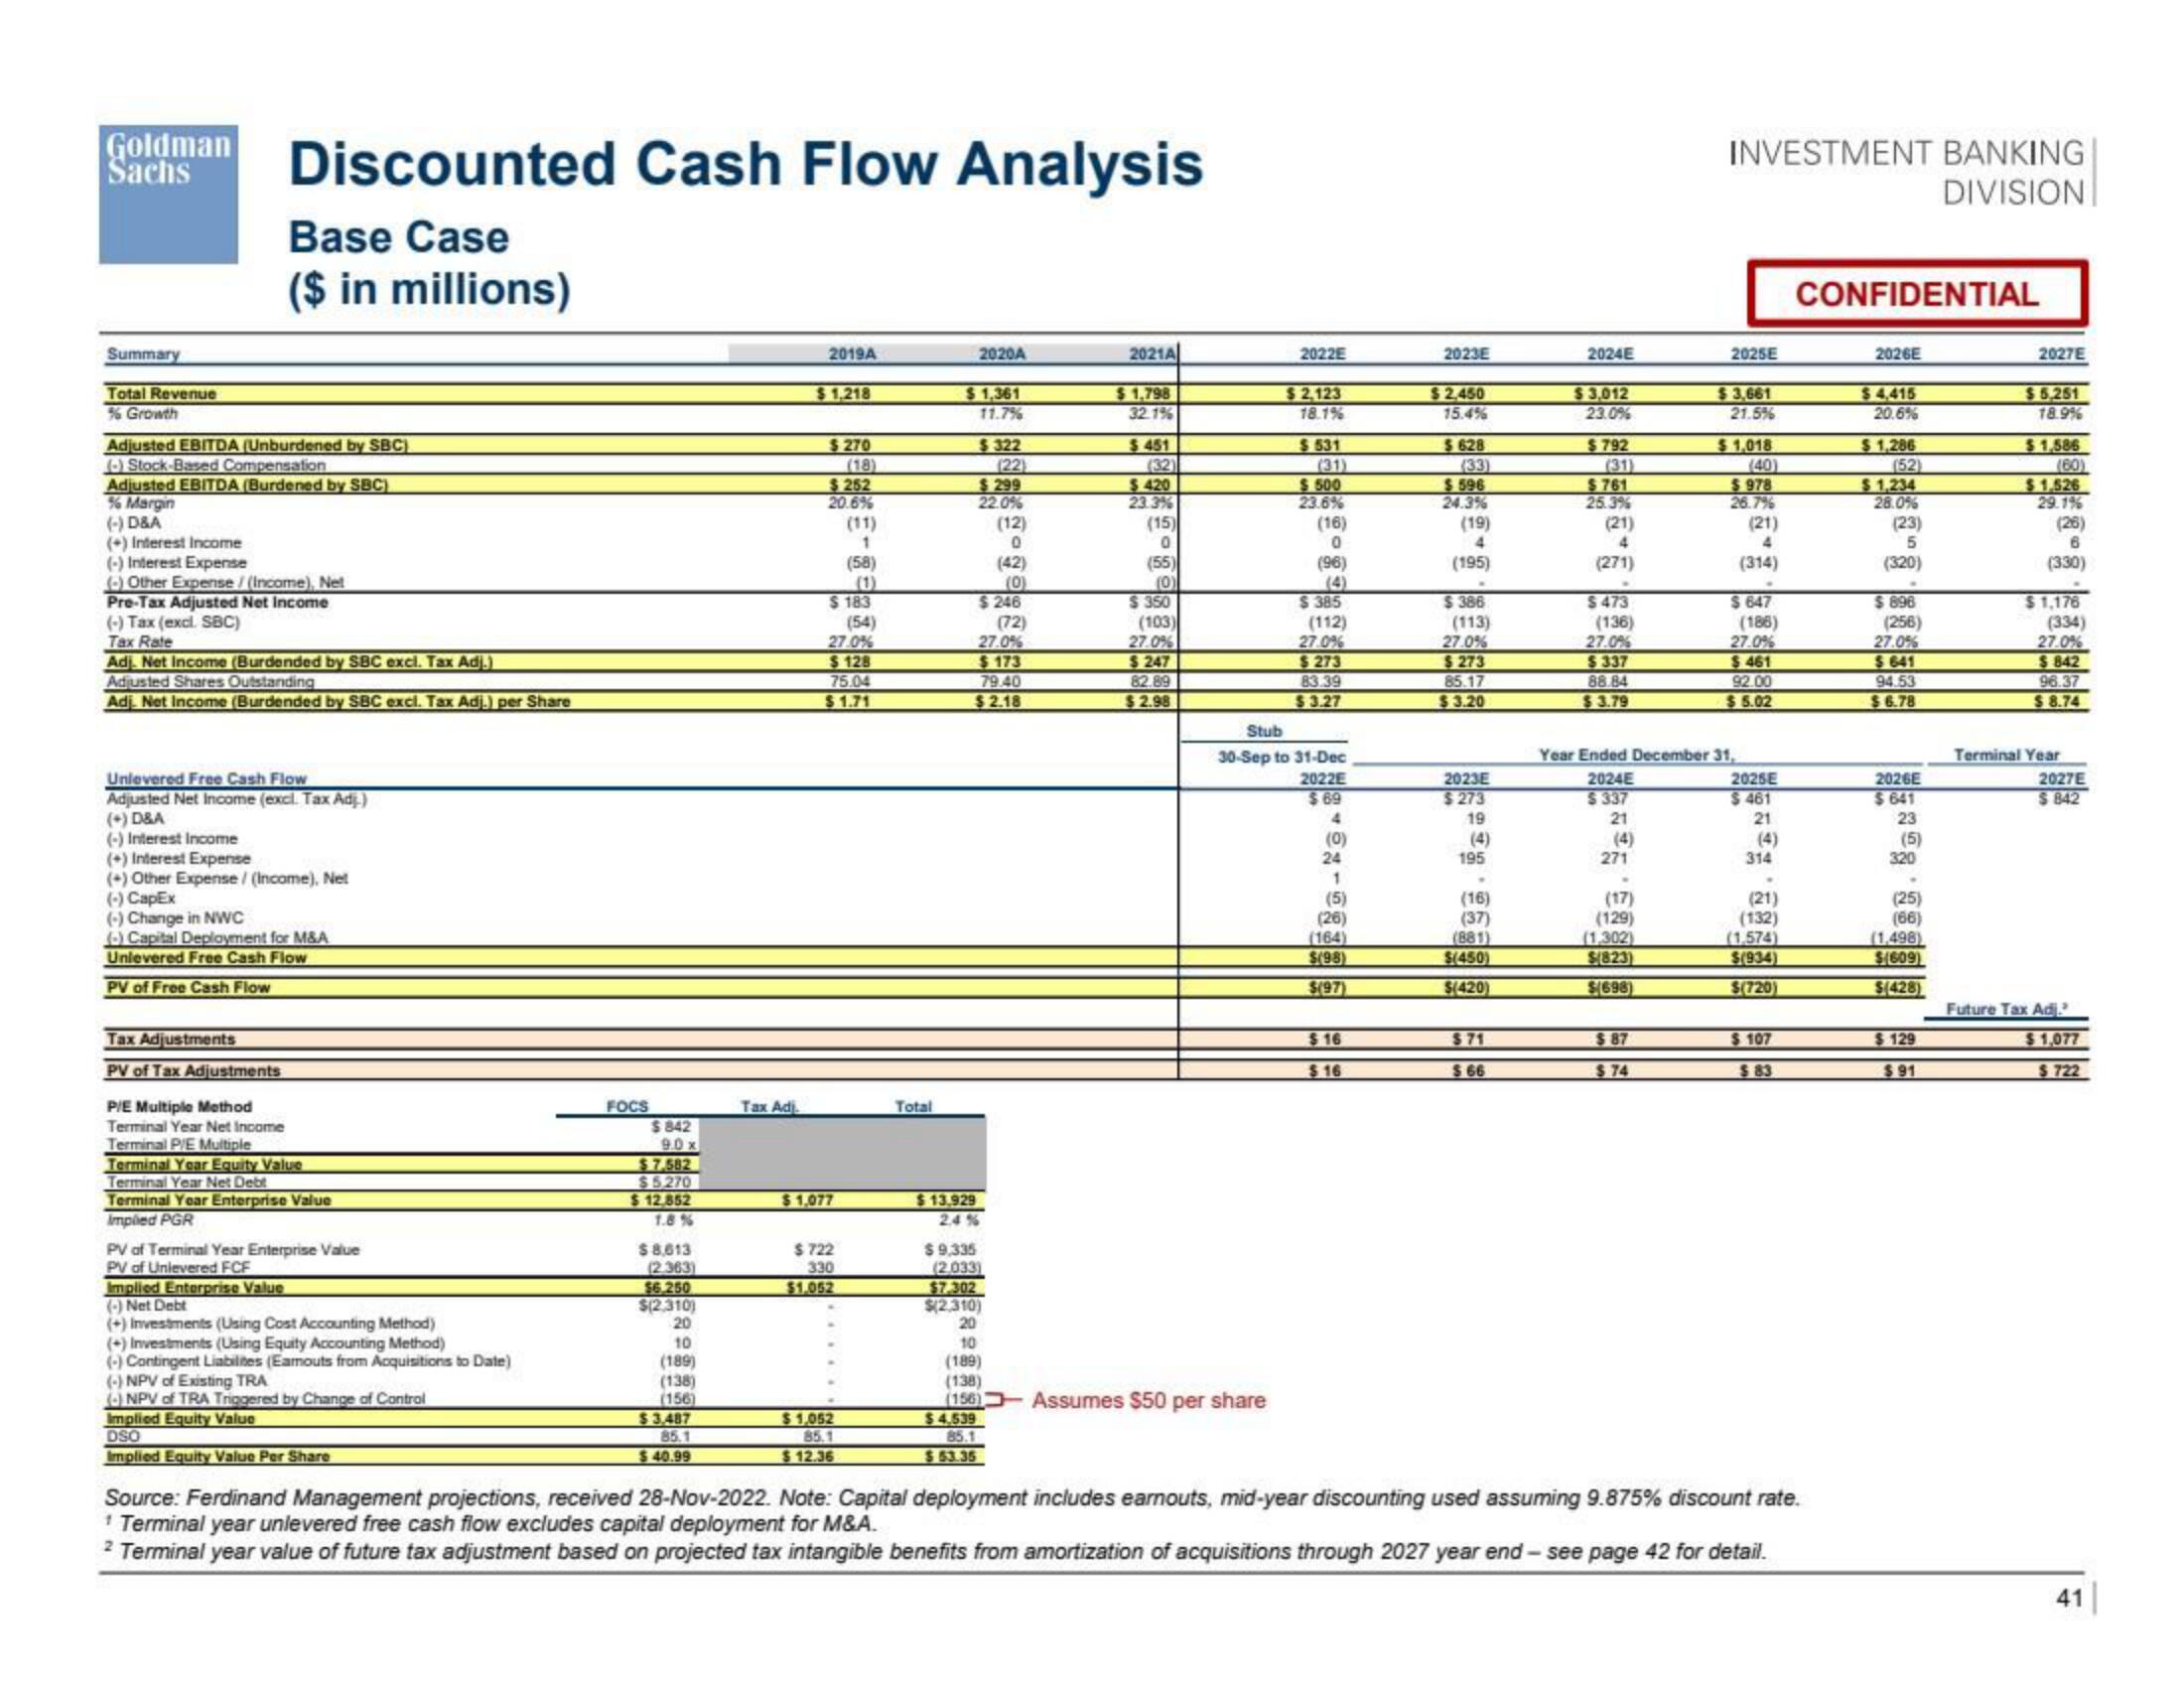
Discounted Cash Flow Analysis
Base Case
($ in millions)
(+) Interest Income
(-) Interest Expense
(-) Other Expense / (Income), Net
Pre-Tax Adjusted Net Income
(-) Tax (excl. SBC)
Tax Rate
Adj. Net Income (Burdended by SBC excl. Tax Adj.)
Adjusted Shares Outstanding
Adj. Net Income (Burdended by SBC excl. Tax Adj.) per Share
Unlevered Free Cash Flow
Adjusted Net Income (excl. Tax Adj.)
(+) D&A
(-) Interest Income
(+) Interest Expense
(+) Other Expense / (Income). Net
(-) CapEx
(-) Change in NWC
(-) Capital Deployment for M&A
Unlevered Free Cash Flow
PV of Free Cash Flow
Tax Adjustments
PV of Tax Adjustments
P/E Multiple Method
Terminal Year Net Income
Terminal P/E Multiple
Terminal Year Equity Value
Terminal Year Net Debt
Terminal Year Enterprise Value
Implied PGR
PV of Terminal Year Enterprise Value
PV of Unlevered FCF
Implied Enterprise Value
(-) Net Debt
(+) Investments (Using Cost Accounting Method)
(+) Investments (Using Equity Accounting Method)
(-) Contingent Liabilites (Eamouts from Acquisitions to Date)
(-) NPV of Existing TRA
(NPV of TRA Triggered by Change of Control
Implied Equity Value
DSO
Implied Equity Value Per Share
FOCS
$842
9.0x
$7.582
$5,270
$12,852
1.8 %
$8,613
(2.363)
$6.250
$(2,310)
20
10
(189)
(138)
(156)
$3,487
85.1
$40.99
Tax Adi
2019A
$1,218
$ 270
(18)
$252
20.6%
$1,077
$ 183
(54)
27.0%
$128
75.04
$1.71
$722
330
$1.052
(11)
1
$1,052
85.1
$ 12.36
(58)
(1)
Total
2020A
$1,361
11.7%
$322
(22)
$299
22.0%
$13.929
2.4%
(12)
0
(42)
(0)
$246
$9,335
(2.033)
27.0%
$173
79.40
$2.18
(72)
2021A
$1,798
32.1%
$451
(32)
$420
23.3%
(15)
0
(55)
(0)
$350
(103)
27.0%
$247
82.89
$2.98
2022E
$7.302
$(2.310)
20
10
(189)
(138)
(156) Assumes $50 per share
$4.539
85.1
$63.35
$2,123
18.1%
$531
$500
23.6%
(16)
0
(96)
$385
(112)
27.0%
$273
83.39
$3.27
Stub
30-Sep to 31-Dec
2022E
$69
4
(0)
24
1
(5)
(26)
(164)
$(98)
$(97)
$16
$16
2023E
$2,450
15.4%
$628
(33)
$596
24.3%
(19)
4
(195)
$ 386
(113)
27.0%
$273
85.17
$3.20
2023E
$273
19
(4)
195
(16)
(37)
(881)
$(450)
$(420)
$71
$66
2024E
$3,012
23.0%
$792
$761
25.3%
(21)
4
(271)
$ 473
(136)
27.0%
$337
88.84
$3.79
(4)
271
(17)
(129)
(1,302)
$(823)
$(698)
INVESTMENT BANKING
DIVISION
Year Ended December 31,
2024E
$ 337
21
$87
$74
2025E
$3,661
21.5%
$1,018
(40)
$978
26.7%
(21)
4
(314)
$ 647
(186)
27.0%
$461
92.00
$5.02
2025E
$461
21
314
(21)
(132)
(1.574)
$(934)
$(720)
$ 107
$83
CONFIDENTIAL
Source: Ferdinand Management projections, received 28-Nov-2022. Note: Capital deployment includes earnouts, mid-year discounting used assuming 9.875% discount rate.
1 Terminal year unlevered free cash flow excludes capital deployment for M&A.
2 Terminal year value of future tax adjustment based on projected tax intangible benefits from amortization of acquisitions through 2027 year end-see page 42 for detail.
2026E
$4,415
20.6%
$1,286
(52)
$1,234
28.0%
(23)
5
(320)
$ 896
(256)
27.0%
$641
94.53
$6.78
2026E
$641
23
(5)
320
.
(25)
(66)
(1,498)
$(609)
$(428)
$129
$91
2027E
$5,251
18.9%
$1,586
(60)
$1,526
29.1%
(26)
6
(330)
$1,176
(334)
27.0%
$842
96.37
$8.74
Terminal Year
2027E
$842
Future Tax Adj.
$1,077
$722
41View entire presentation