Q2 Quarter 2023
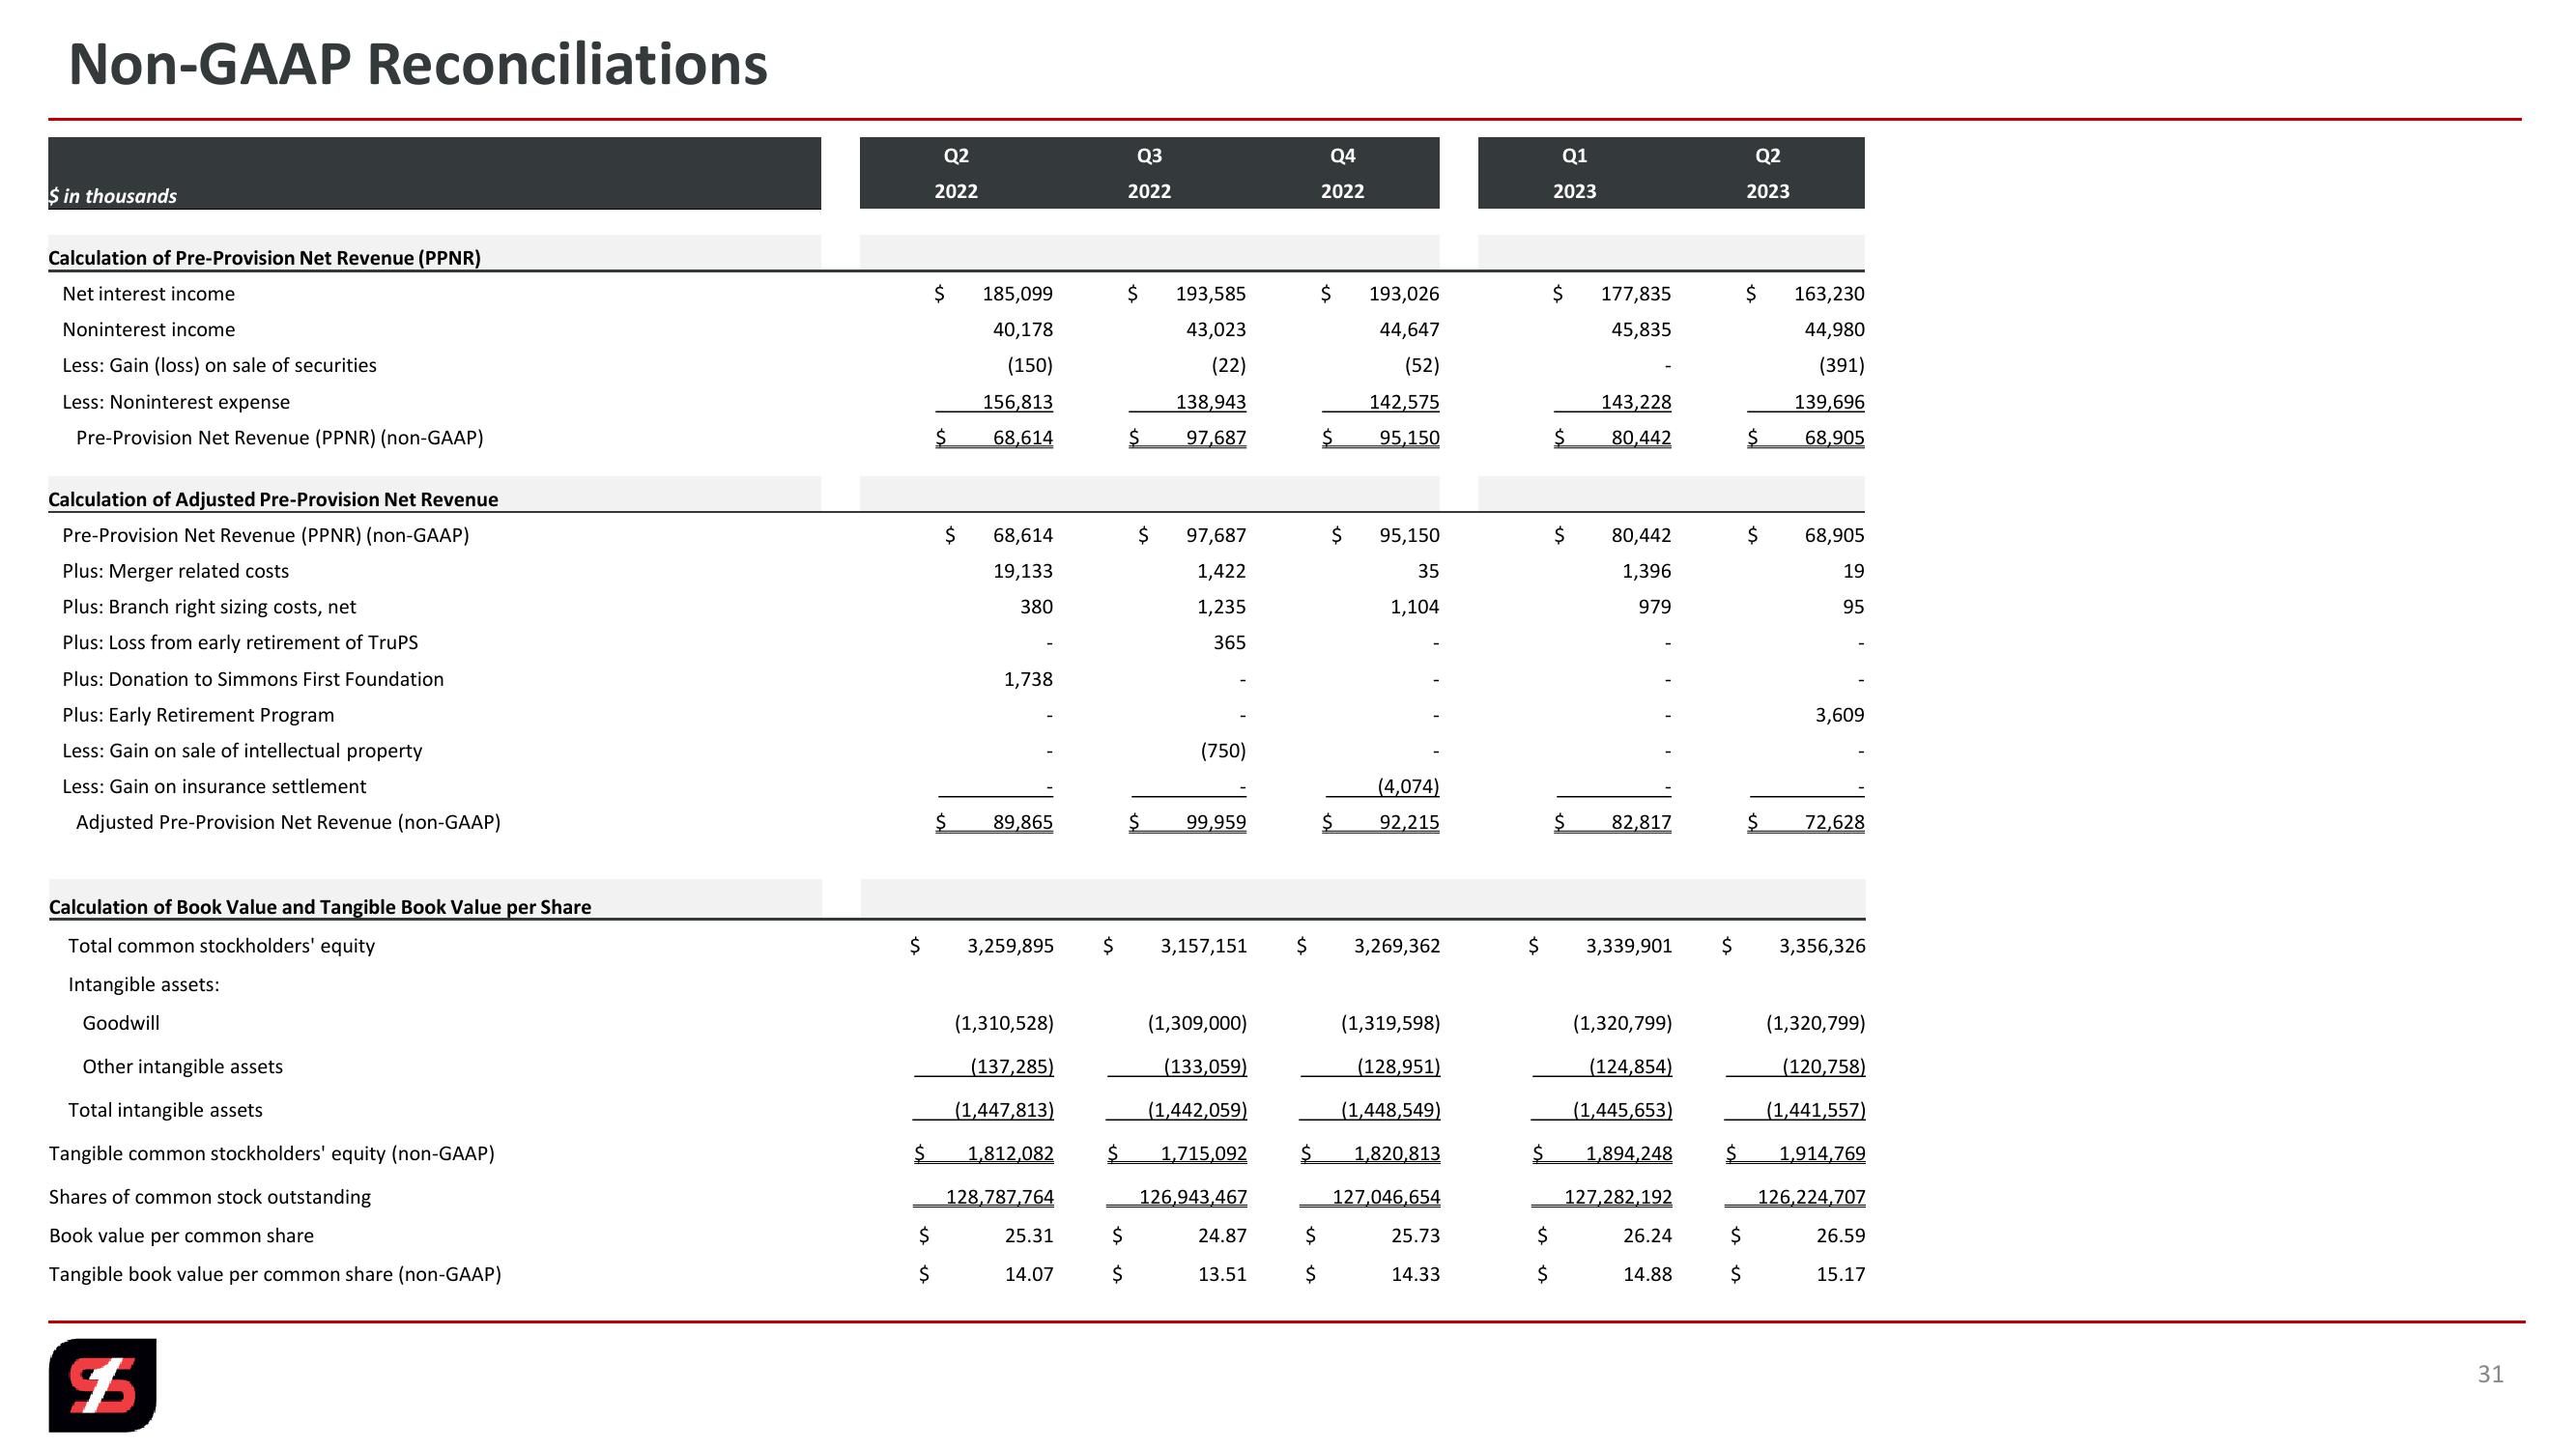
Non-GAAP Reconciliations
$ in thousands
Calculation of Pre-Provision Net Revenue (PPNR)
Net interest income
Noninterest income
Less: Gain (loss) on sale of securities
Less: Noninterest expense
Pre-Provision Net Revenue (PPNR) (non-GAAP)
Calculation of Adjusted Pre-Provision Net Revenue
Pre-Provision Net Revenue (PPNR) (non-GAAP)
Plus: Merger related costs
Plus: Branch right sizing costs, net
Plus: Loss from early retirement of TruPS
Plus: Donation to Simmons First Foundation
Plus: Early Retirement Program
Less: Gain on sale of intellectual property
Less: Gain on insurance settlement
Adjusted Pre-Provision Net Revenue (non-GAAP)
Q2
2022
Q3
2022
Q4
2022
Q1
2023
Q2
2023
$
185,099
$
193,585
$
193,026
$
40,178
43,023
44,647
177,835
45,835
$
163,230
44,980
(150)
(22)
(52)
(391)
156,813
138,943
142,575
143,228
139,696
$
68,614
$
97,687
$
95,150
$
80,442
$
68,905
$
68,614
$
97,687
$
95,150
$
19,133
1,422
35
380
1,235
1,104
80,442
1,396
979
$
68,905
19
95
365
1,738
(750)
3,609
(4,074)
$
89,865
$
99,959
$ 92,215
$ 82,817
$ 72,628
Calculation of Book Value and Tangible Book Value per Share
Total common stockholders' equity
$
3,259,895
$ 3,157,151
$ 3,269,362
$ 3,339,901
$ 3,356,326
Intangible assets:
(1,310,528)
(137,285)
(1,447,813)
(1,309,000)
(1,319,598)
(133,059)
(1,442,059)
(128,951)
(1,448,549)
(1,320,799)
(124,854)
(1,445,653)
(1,320,799)
(120,758)
(1,441,557)
$ 1,715,092
$ 1,820,813
$ 1,894,248
128,787,764
126,943,467
127,046,654
127,282,192
$ 1,914,769
126,224,707
$
25.31
$
24.87
$
25.73
$
26.24
$
26.59
$
14.07
$
13.51
$
14.33
$
14.88
$
15.17
Goodwill
Other intangible assets
Total intangible assets
Tangible common stockholders' equity (non-GAAP)
Shares of common stock outstanding
Book value per common share
Tangible book value per common share (non-GAAP)
$ 1,812,082
$5
31View entire presentation