Momentus SPAC Presentation Deck
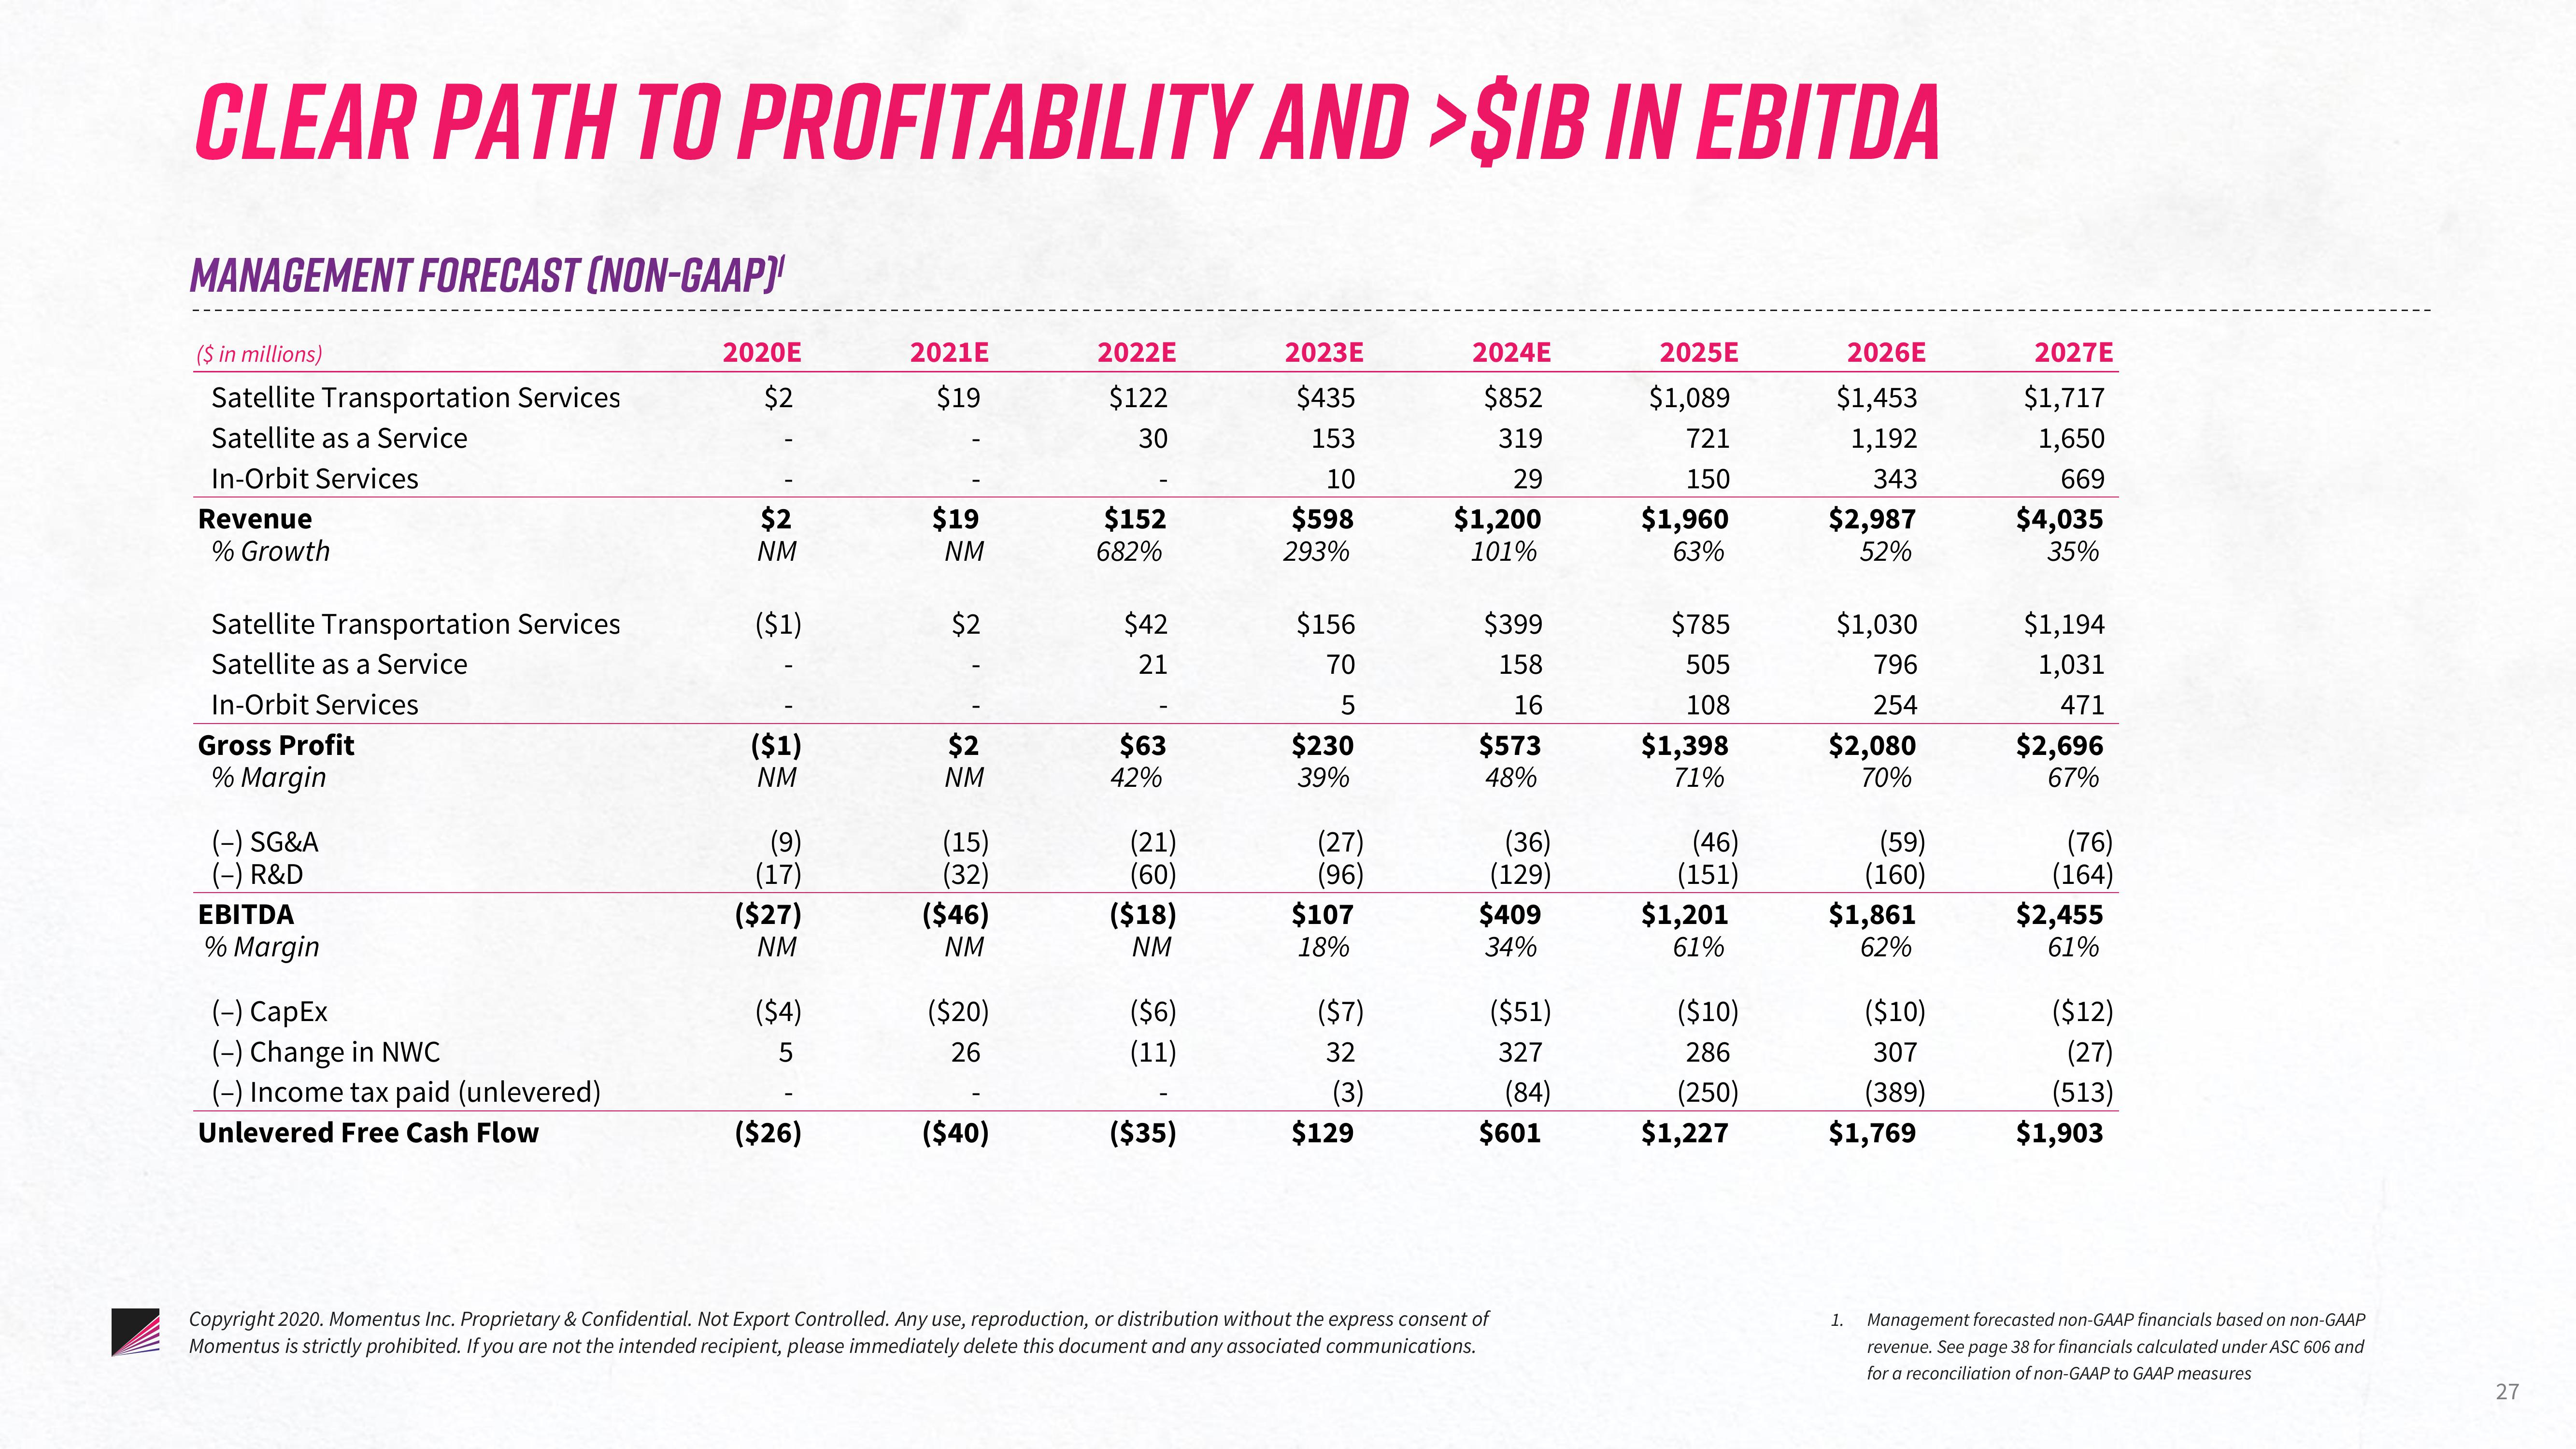
CLEAR PATH TO PROFITABILITY AND >$IB IN EBITDA
MANAGEMENT FORECAST (NON-GAAP)
($ in millions)
Satellite Transportation Services
Satellite as a Service
In-Orbit Services
Revenue
% Growth
Satellite Transportation Services
Satellite as a Service
In-Orbit Services
Gross Profit
% Margin
(-) SG&A
(-) R&D
EBITDA
% Margin
(-) CapEx
(-) Change in NWC
(-) Income tax paid (unlevered)
Unlevered Free Cash Flow
2020E
$2
$2
NM
($1)
($1)
NM
(9)
(17)
($27)
NM
($4)
5
($26)
2021E
$19
$19
NM
$2
$2
NM
(15)
(32)
($46)
NM
($20)
26
($40)
2022E
$122
30
$152
682%
$42
21
$63
42%
(21)
(60)
($18)
NM
($6)
(11)
($35)
2023E
$435
153
10
$598
293%
$156
70
5
$230
39%
(27)
(96)
$107
18%
($7)
32
(3)
$129
2024E
$852
319
29
$1,200
101%
$399
158
16
$573
48%
(36)
(129)
$409
34%
($51)
327
(84)
$601
Copyright 2020. Momentus Inc. Proprietary & Confidential. Not Export Controlled. Any use, reproduction, or distribution without the express consent of
Momentus is strictly prohibited. If you are not the intended recipient, please immediately delete this document and any associated communications.
2025E
$1,089
721
150
$1,960
63%
$785
505
108
$1,398
71%
(46)
(151)
$1,201
61%
($10)
286
(250)
$1,227
2026E
$1,453
1,192
343
$2,987
52%
$1,030
796
254
$2,080
70%
(59)
(160)
$1,861
62%
($10)
307
(389)
$1,769
2027E
$1,717
1,650
669
$4,035
35%
$1,194
1,031
471
$2,696
67%
(76)
(164)
$2,455
61%
($12)
(27)
(513)
$1,903
1. Management forecasted non-GAAP financials based on non-GAAP
revenue. See page 38 for financials calculated under ASC 606 and
for a reconciliation of non-GAAP to GAAP measures
27View entire presentation