Azerion Investor Conference Presentation Deck
Financials - Additional Information
1.4 Selected KPIs
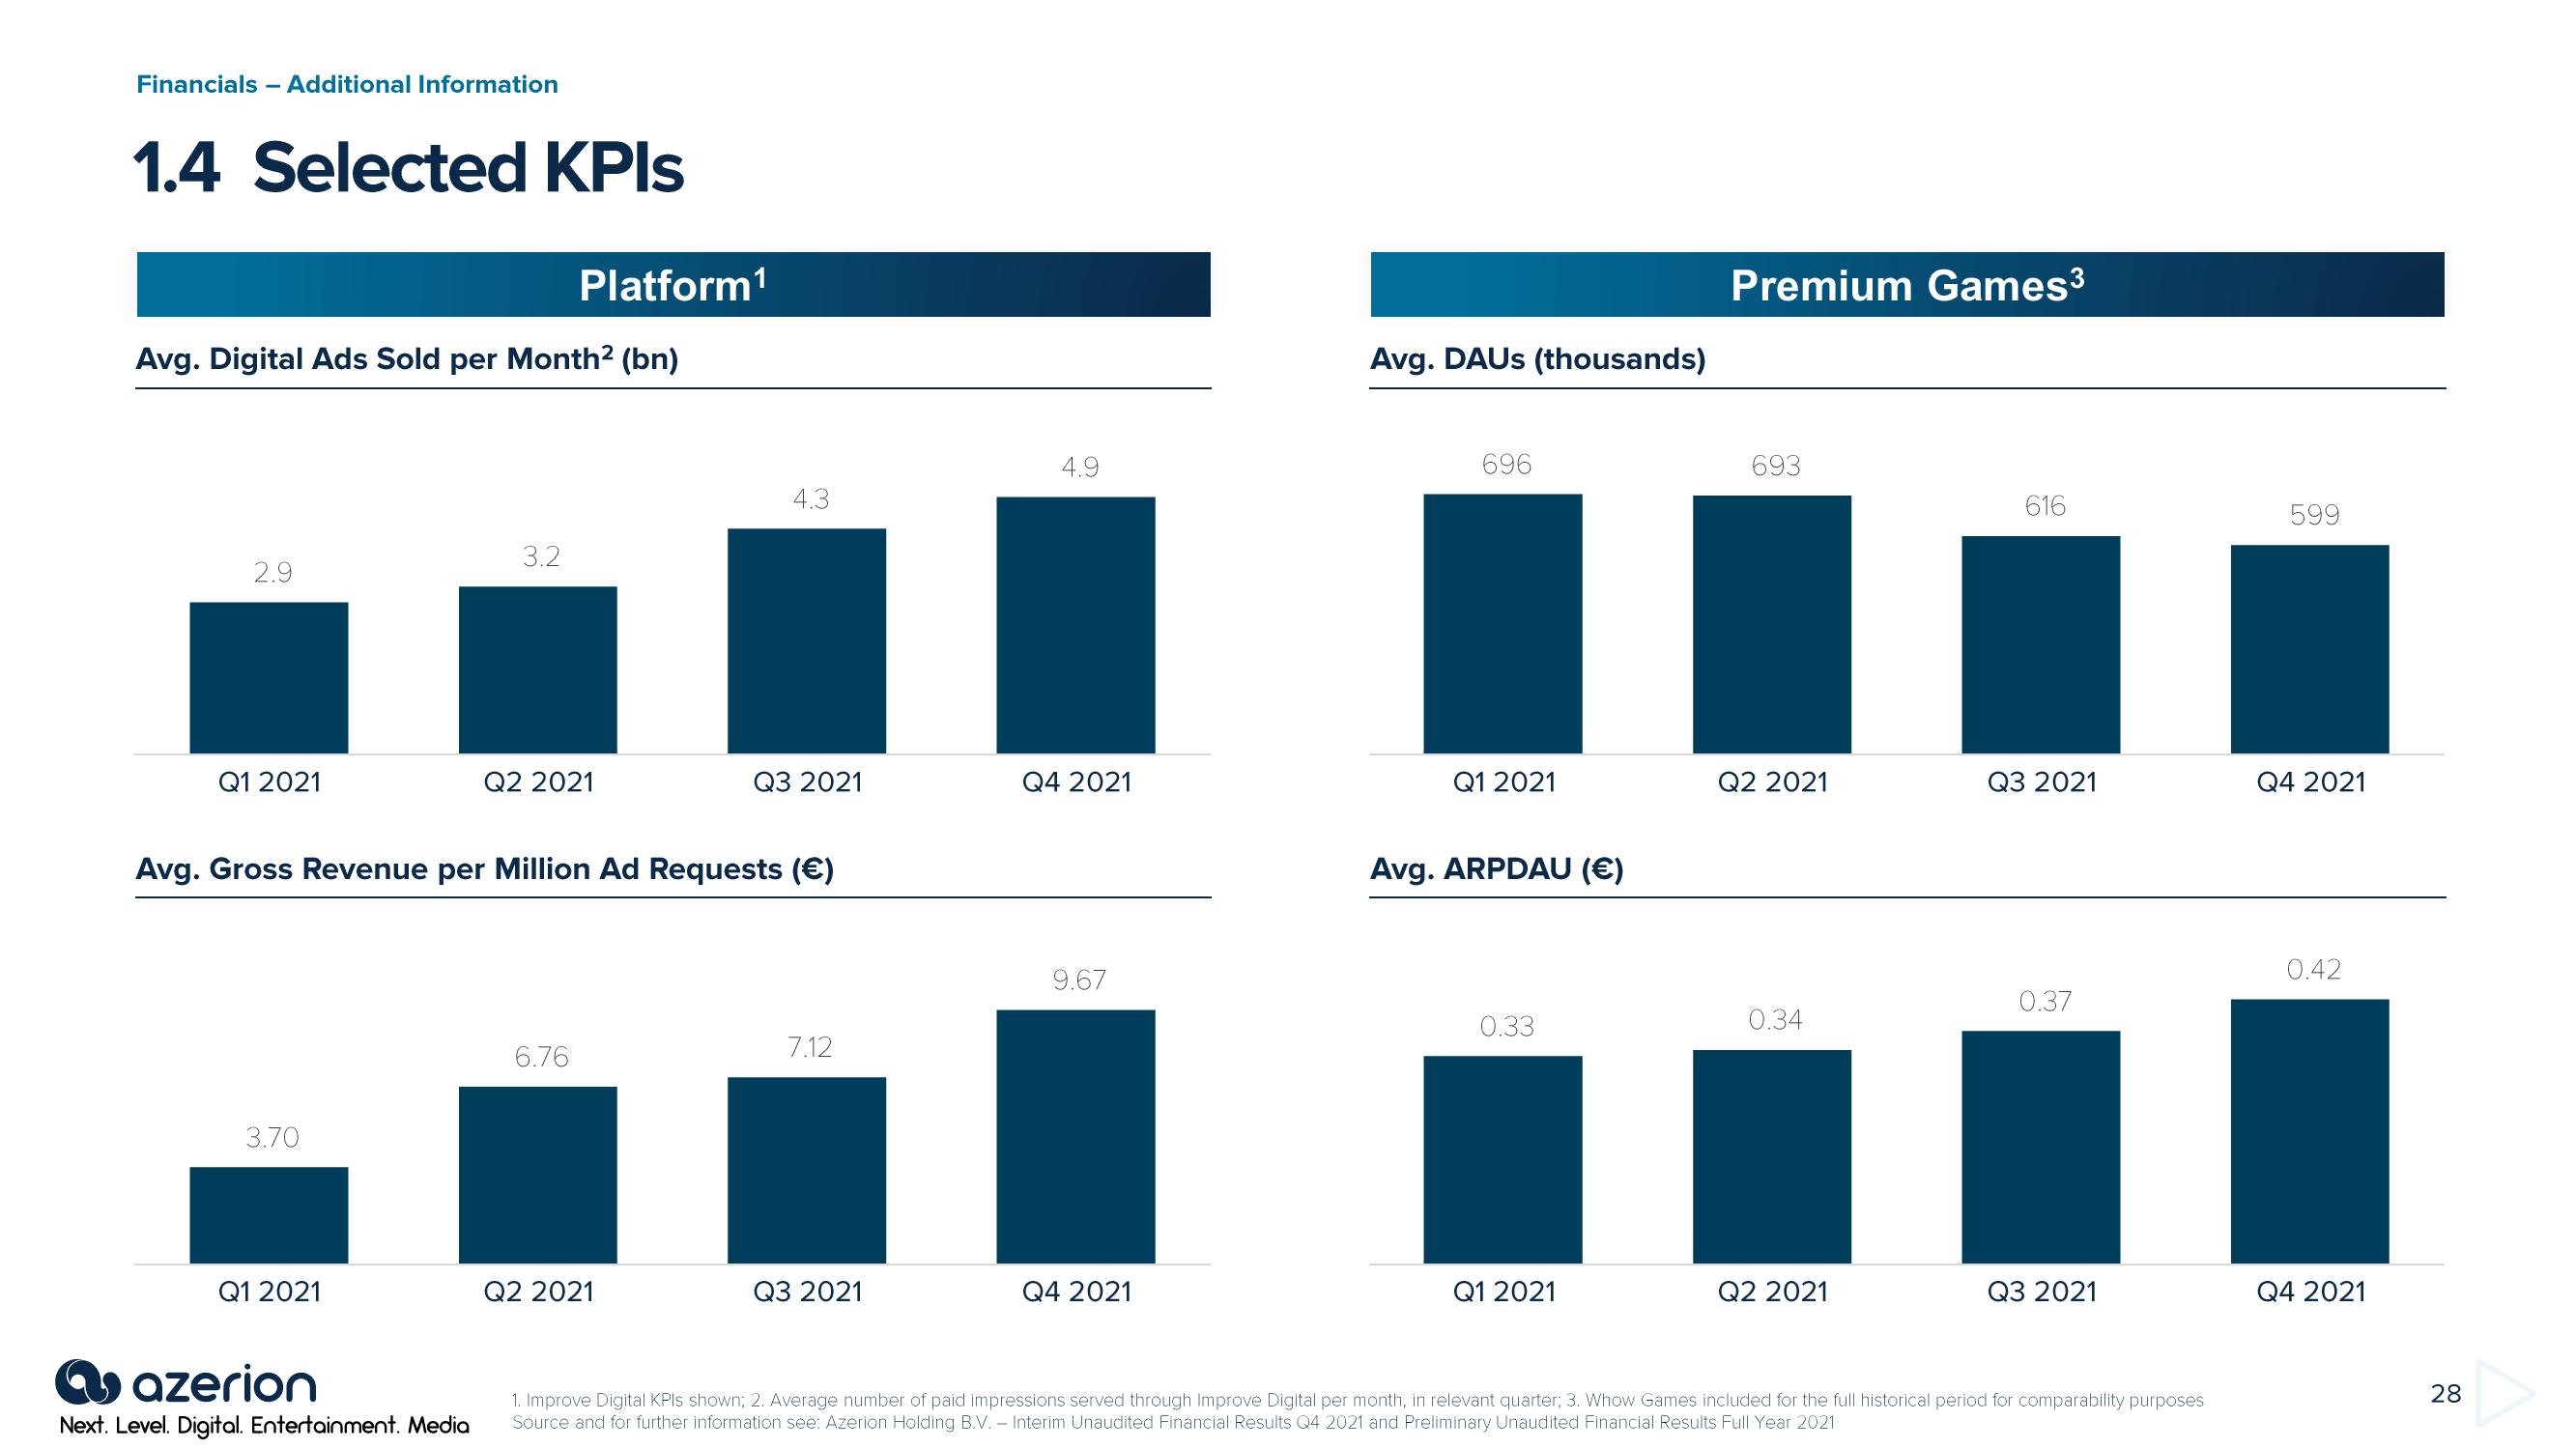
Avg. Digital Ads Sold per Month² (bn)
2.9
Q1 2021
3.70
Q1 2021
3.2
azerion
Next. Level. Digital. Entertainment. Media
Platform¹
Q2 2021
Avg. Gross Revenue per Million Ad Requests (€)
6.76
4.3
Q2 2021
Q3 2021
7.12
Q3 2021
4.9
Q4 2021
9.67
Q4 2021
Avg. DAUS (thousands)
696
Q1 2021
Avg. ARPDAU (€)
0.33
Q1 2021
Premium Games³
693
Q2 2021
0.34
Q2 2021
616
Q3 2021
0.37
Q3 2021
1. Improve Digital KPIs shown; 2. Average number of paid impressions served through Improve Digital per month, in relevant quarter; 3. Whow Games included for the full historical period for comparability purposes
Source and for further information see: Azerion Holding B.V. - Interim Unaudited Financial Results Q4 2021 and Preliminary Unaudited Financial Results Full Year 2021
599
Q4 2021
0.42
Q4 2021
28View entire presentation