AngloAmerican Results Presentation Deck
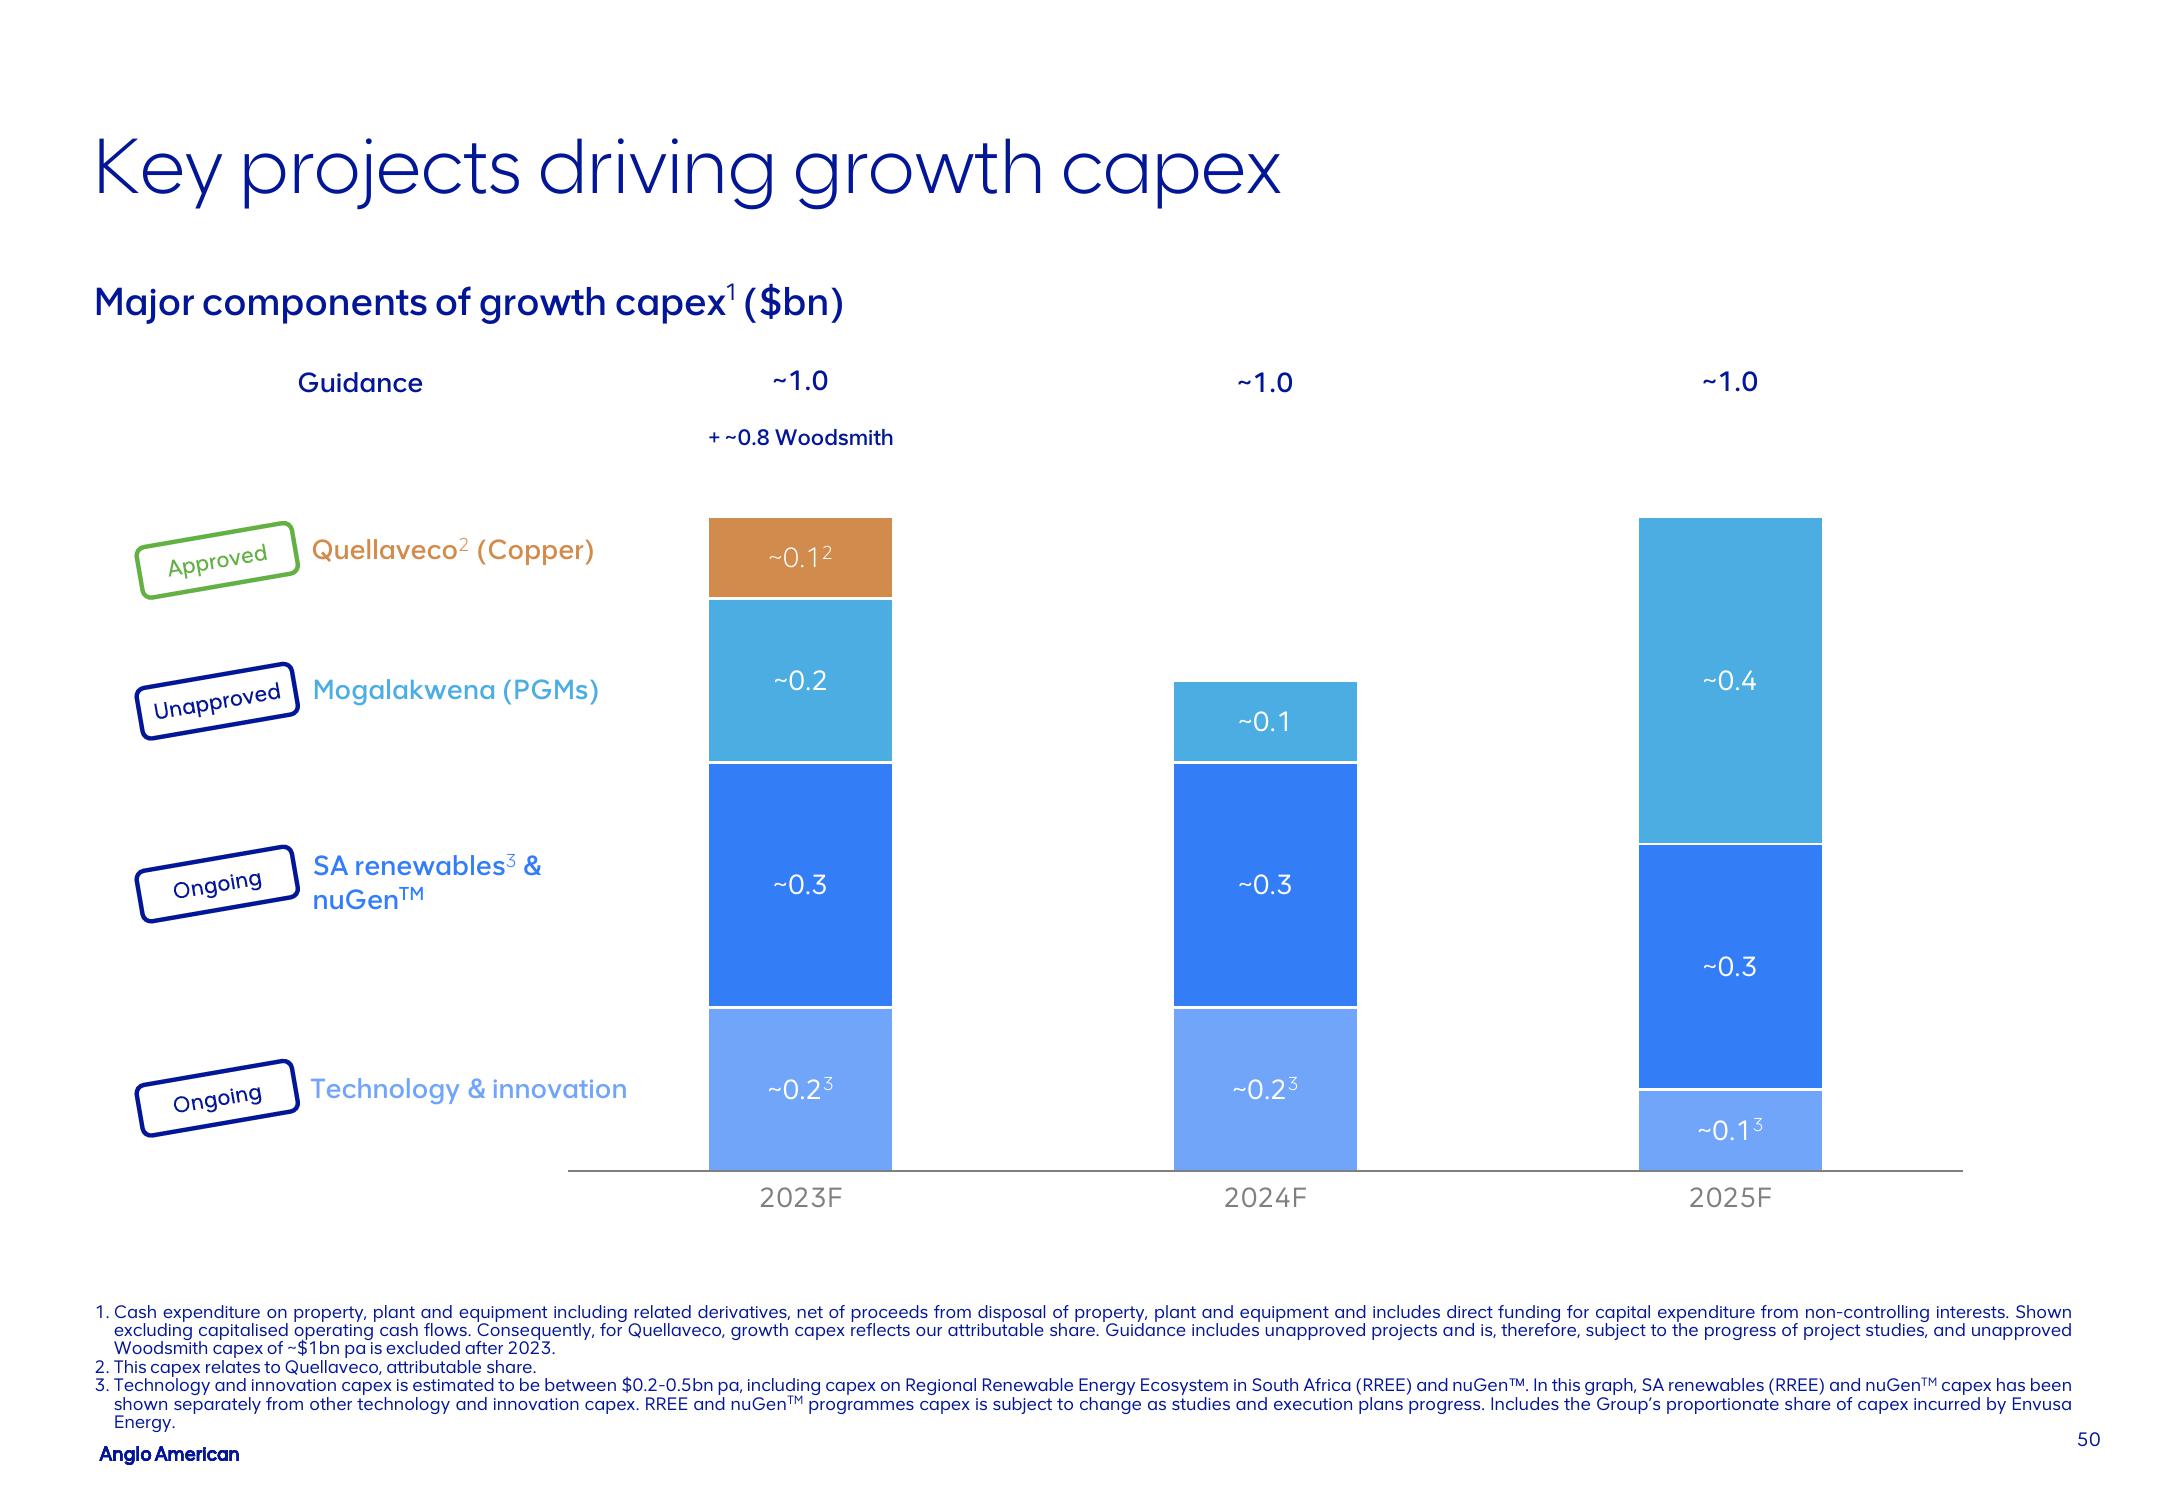
Key projects driving growth capex
Major components of growth capex¹ ($bn)
Approved
Ongoing
Guidance
Unapproved Mogalakwena (PGMS)
Ongoing
Quellaveco² (Copper)
SA renewables³ &
nuGen™
Technology & innovation
~1.0
+ ~0.8 Woodsmith
~0.1²
~0.2
~0.3
~0.23
2023F
~1.0
~0.1
~0.3
~0.23
2024F
~1.0
~0.4
~0.3
~0.13
2025F
1. Cash expenditure on property, plant and equipment including related derivatives, net of proceeds from disposal of property, plant and equipment and includes direct funding for capital expenditure from non-controlling interests. Shown
excluding capitalised operating cash flows. Consequently, for Quellaveco, growth capex reflects our attributable share. Guidance includes unapproved projects and is, therefore, subject to the progress of project studies, and unapproved
Woodsmith capex of ~$1bn pa is excluded after 2023.
2. This capex relates to Quellaveco, attributable share.
3. Technology and innovation capex is estimated to be between $0.2-0.5bn pa, including capex on Regional Renewable Energy Ecosystem in South Africa (RREE) and nuGenTM. In this graph, SA renewables (RREE) and nuGenTM capex has been
shown separately from other technology and innovation capex. RREE and nuGenTM programmes capex is subject to change as studies and execution plans progress. Includes the Group's proportionate share of capex incurred by Envusa
Energy.
Anglo American
50View entire presentation