Avantor Results Presentation Deck
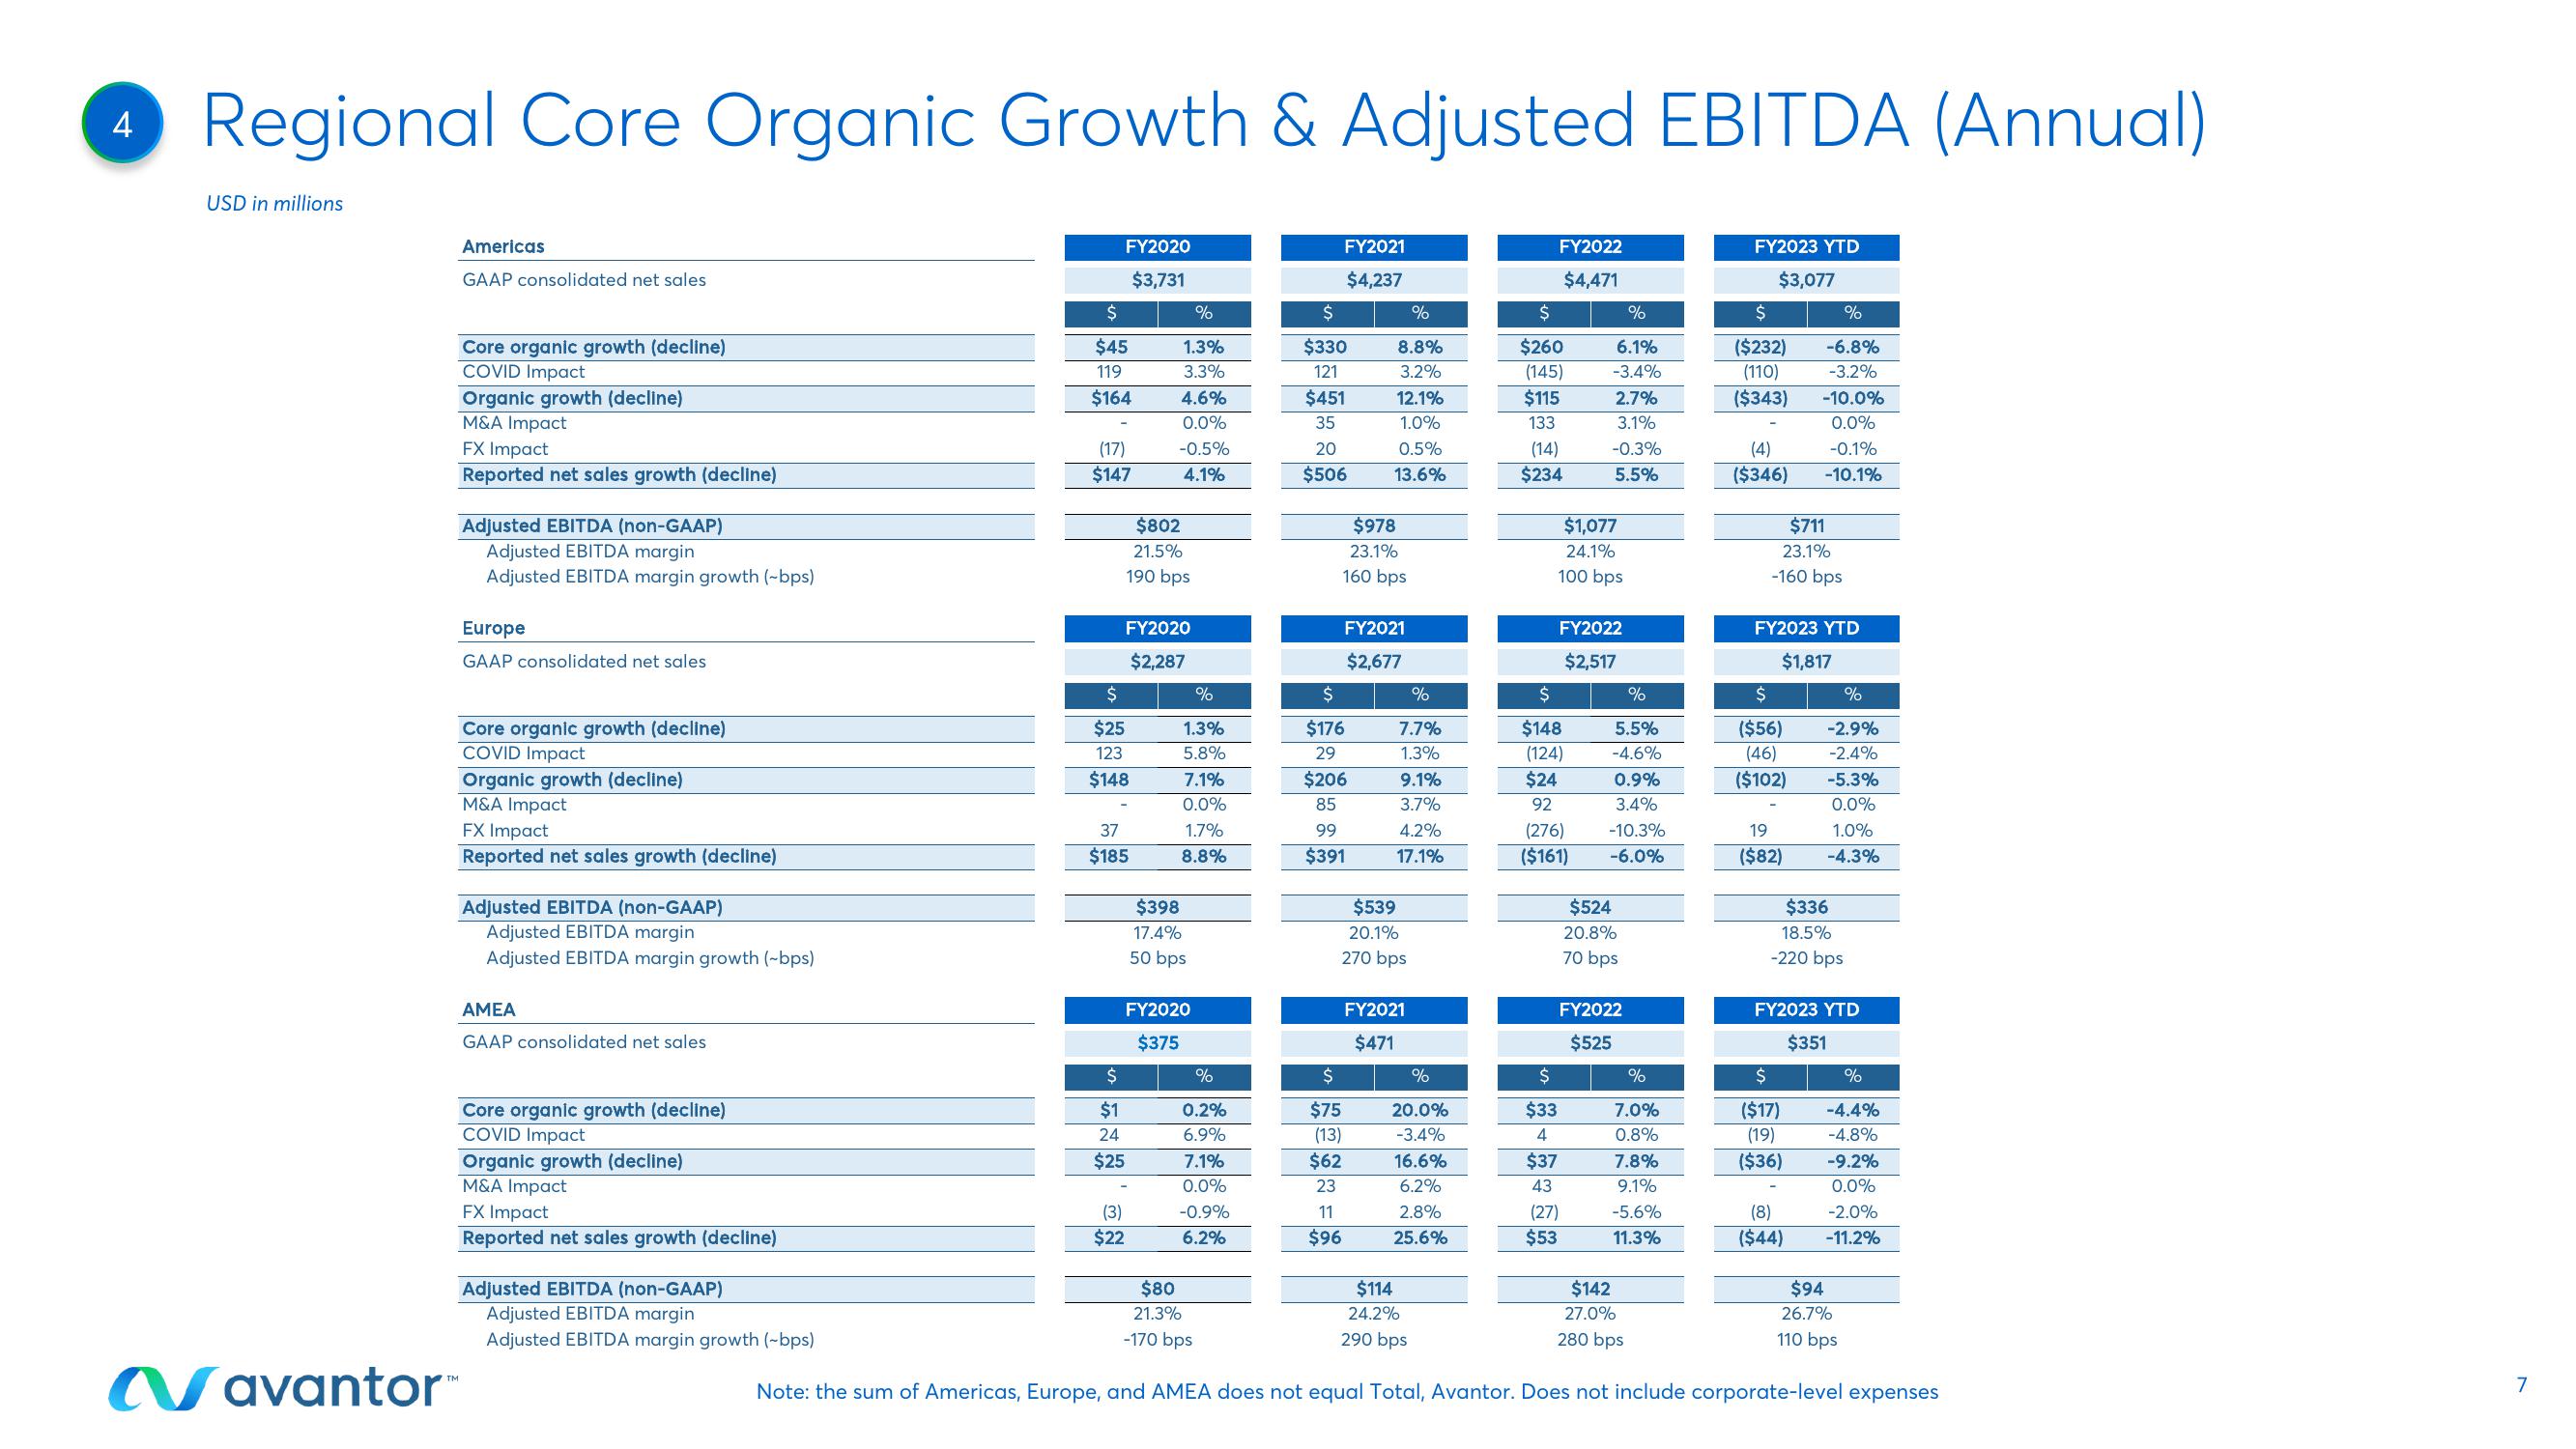
4 Regional Core Organic Growth & Adjusted EBITDA (Annual)
USD in millions
Navantor™
Americas
GAAP consolidated net sales
Core organic growth (decline)
COVID Impact
Organic growth (decline)
M&A Impact
FX Impact
Reported net sales growth (decline)
Adjusted EBITDA (non-GAAP)
Adjusted EBITDA margin
Adjusted EBITDA margin growth (-bps)
Europe
GAAP consolidated net sales
Core organic growth (decline)
COVID Impact
Organic growth (decline)
M&A Impact
FX Impact
Reported net sales growth (decline)
Adjusted EBITDA (non-GAAP)
Adjusted EBITDA margin
Adjusted EBITDA margin growth (~bps)
AMEA
GAAP consolidated net sales
Core organic growth (decline)
COVID Impact
Organic growth (decline)
M&A Impact
FX Impact
Reported net sales growth (decline)
Adjusted EBITDA (non-GAAP)
Adjusted EBITDA margin
Adjusted EBITDA margin growth (~bps)
FY2020
$3,731
$
$45
119
$164
(17)
$147
$
$1
24
$25
$802
21.5%
190 bps
$
$25
123
$148
FY2020
$2,287
37
$185
%
1.3%
3.3%
4.6%
0.0%
-0.5%
4.1%
(3)
$22
%
1.3%
5.8%
7.1%
0.0%
1.7%
8.8%
$398
17.4%
50 bps
FY2020
$375
%
0.2%
6.9%
7.1%
0.0%
-0.9%
6.2%
$
$330
121
$451
35
20
$506
FY2021
$4,237
$
$176
29
$978
23.1%
160 bps
$206
85
%
8.8%
3.2%
12.1%
1.0%
0.5%
13.6%
FY2021
$2,677
99
$391
$
$75
(13)
$62
23
11
$96
%
7.7%
1.3%
9.1%
3.7%
4.2%
17.1%
$539
20.1%
270 bps
FY2021
$471
%
20.0%
-3.4%
16.6%
6.2%
2.8%
25.6%
FY2022
$4,471
$
$260
(145)
$115
133
(14)
$234
$1,077
24.1%
100 bps
%
6.1%
-3.4%
2.7%
3.1%
-0.3%
5.5%
FY2022
$2,517
$
$148
(124)
$24
92
(276)
($161)
$
$33
4
$37
43
(27)
$53
%
5.5%
-4.6%
0.9%
3.4%
-10.3%
-6.0%
$524
20.8%
70 bps
FY2022
$525
%
7.0%
0.8%
7.8%
9.1%
-5.6%
11.3%
FY2023 YTD
$3,077
$
($232)
(110)
($343)
(4)
($346)
$711
23.1%
-160 bps
FY2023 YTD
$1,817
$
($56)
(46)
($102)
19
($82)
%
-6.8%
-3.2%
-10.0%
0.0%
-0.1%
-10.1%
$336
18.5%
-220 bps
$
($17)
(19)
($36)
%
-2.9%
-2.4%
-5.3%
0.0%
1.0%
-4.3%
FY2023 YTD
$351
(8)
($44)
%
-4.4%
-4.8%
-9.2%
0.0%
-2.0%
-11.2%
$80
21.3%
-170 bps
$114
24.2%
290 bps
$142
27.0%
280 bps
Note: the sum of Americas, Europe, and AMEA does not equal Total, Avantor. Does not include corporate-level expenses
$94
26.7%
110 bps
7View entire presentation