TPG Results Presentation Deck
Other Operating Metrics
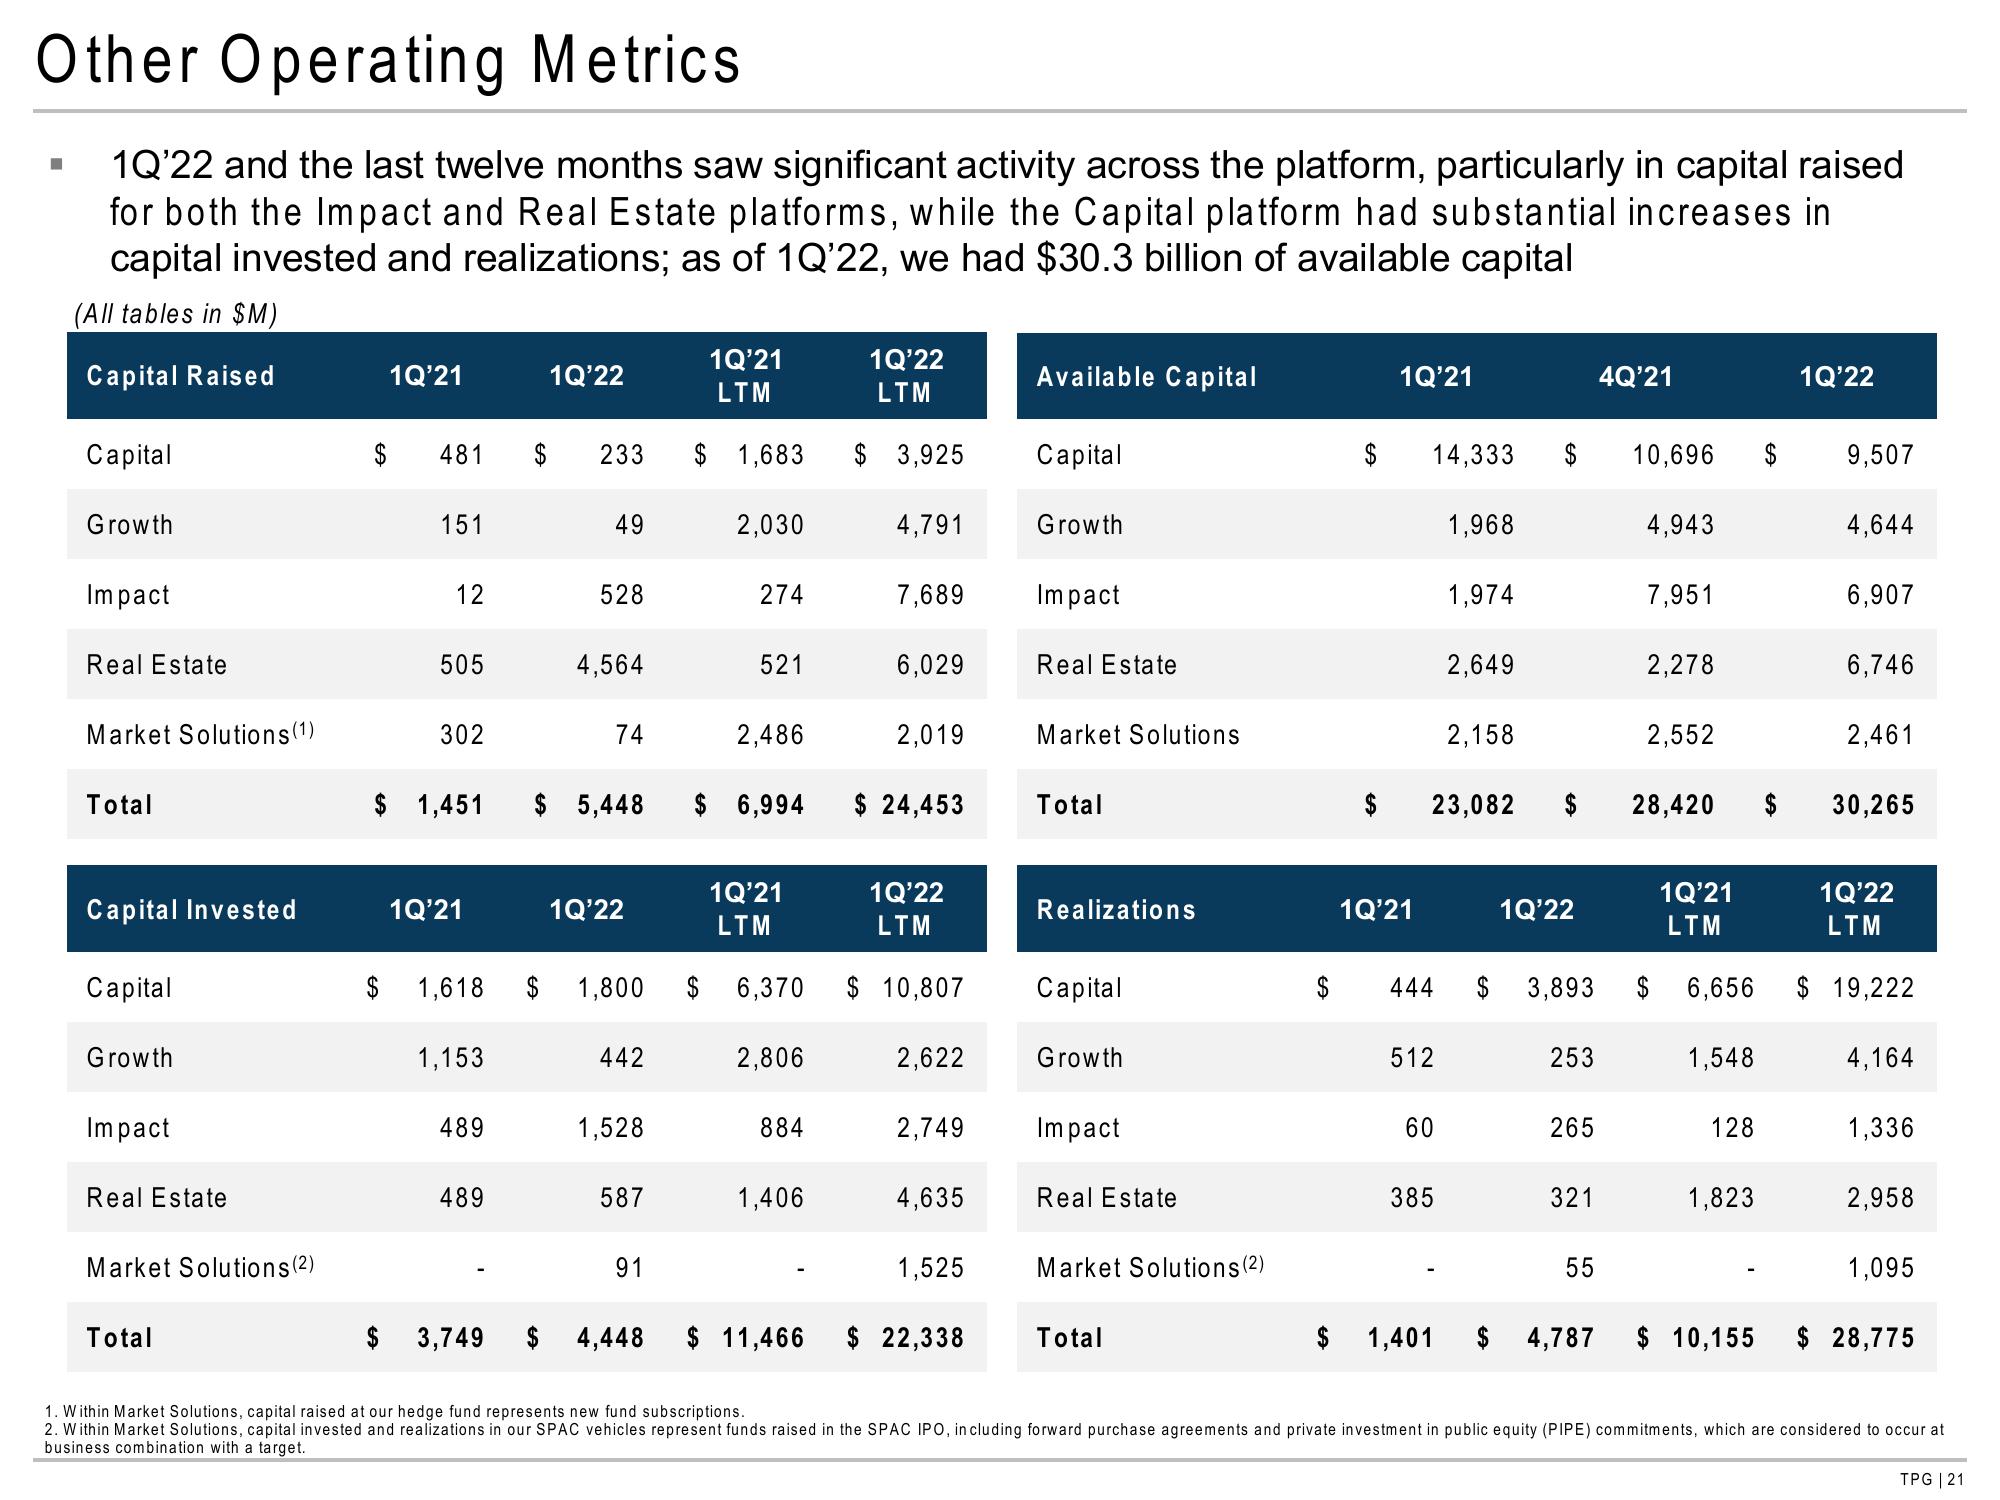
1Q'22 and the last twelve months saw significant activity across the platform, particularly in capital raised
for both the Impact and Real Estate platforms, while the Capital platform had substantial increases in
capital invested and realizations; as of 1Q'22, we had $30.3 billion of available capital
(All tables in $M)
Capital Raised
■
Capital
Growth
Impact
Real Estate
Market Solutions (1)
Total
Capital Invested
Capital
Growth
Impact
Real Estate
Market Solutions (2)
Total
$
1Q'21
481
151
12
505
302
1Q'21
1,618
1,153
489
489
1Q'22
$ 1,451 $ 5,448
$ 3,749
233
49
528
4,564
74
1Q'22
442
1,528
587
91
1Q'21
LTM
$ 1,683
$ 4,448
2,030
274
521
2,486
1Q'21
LTM
1Q'22
LTM
$ 1,800 $ 6,370 $ 10,807
2,806
1Q'22
LTM
$ 3,925
4,791
31
884
7,689
1,406
29
$ 6,994 $ 24,453
6,029
2,019
22
2,622
2,749
4,635
1,525
Available Capital
$ 11,466 $ 22,338
8
Capital
Gro
Growth
Impact
Re
Real Estate
Market Solutions
Total
Realizations
Capital
Gr
35 Rea
Growth
Impact
Real Estate
Market Solutions (2)
To
Total
$
1Q'21
14,333
1Q'21
444
$ 23,082
512
60
385
1,968
1,974
1,401
2,649
2,158
1Q'22
253
265
321
55
4Q'21
$ 4,787
10,696 $
4,943
$ 3,893 $
7,951
2,278
2,552
28,420
1Q'21
LTM
6,656
1,548
128
1,823
$ 10,155
1Q'22
9,507
4,644
6,907
6,746
2,461
30,265
1Q'22
LTM
$ 19,222
4,164
1,336
2,958
1,095
$ 28,775
1. Within Market Solutions, capital raised at our hedge fund represents new fund subscriptions.
2. Within Market Solutions, capital invested and realizations in our SPAC vehicles represent funds raised in the SPAC IPO, including forward purchase agreements and private investment in public equity (PIPE) commitments, which are considered to occur at
business combination with a target.
TPG | 21View entire presentation