Paysafe Results Presentation Deck
Leverage summary
Facility
Term Loan Facility (USD)
Term Loan Facility (EUR)
Revolver (EUR) (USD)
Secured Loan Notes (EUR)
Secured Loan Notes (USD)
Paysafe:
Fixed rate vs.
Floating rate
Floating, 0.5% rate floor
Floating, 0.0% rate floor
Floating, 0.0% rate floor
Fixed
Fixed
Interest
rate
USD LIBOR + 2.75%
EURIBOR + 3.00%
EURIBOR/USD LIBOR +2.25%
3.00%
4.00%
Outstanding
($m)
$1,009
735
36
456
Total Debt(1)
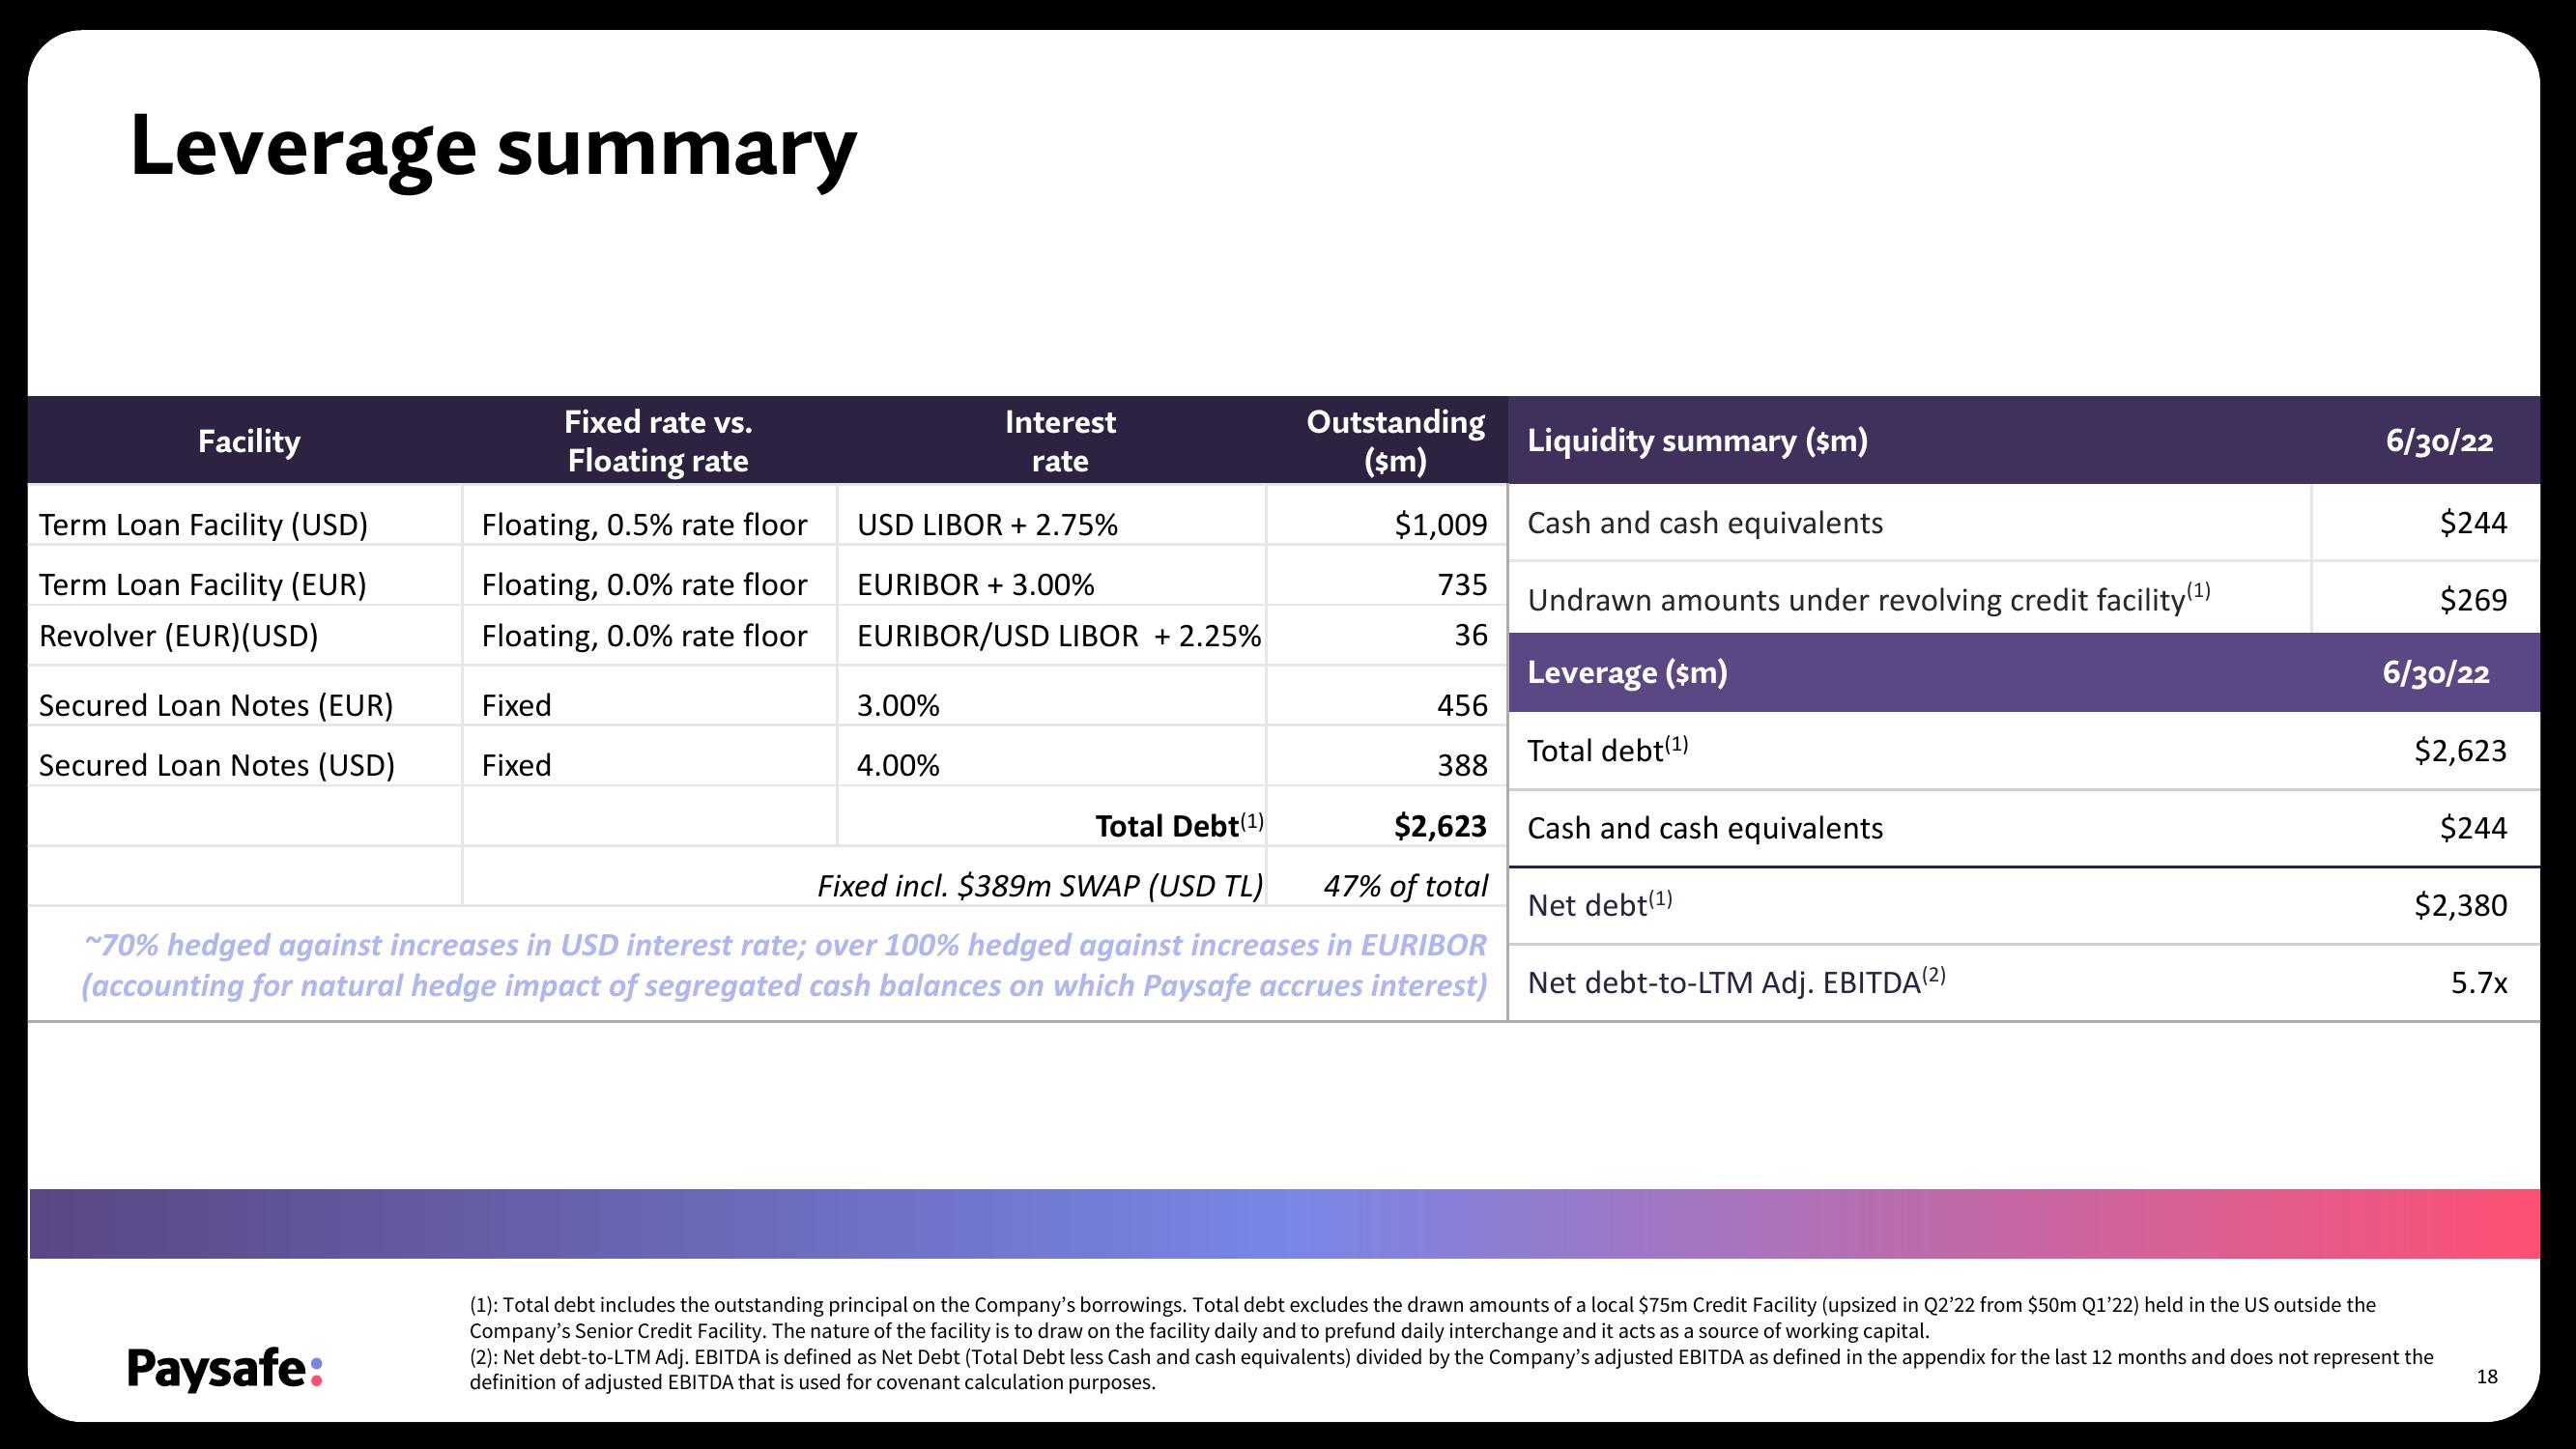
Fixed incl. $389m SWAP (USD TL)
388
$2,623
47% of total
~70% hedged against increases in USD interest rate; over 100% hedged against increases in EURIBOR
(accounting for natural hedge impact of segregated cash balances on which Paysafe accrues interest)
Liquidity summary ($m)
Cash and cash equivalents
Undrawn amounts under revolving credit facility (¹)
Leverage ($m)
Total debt(¹)
Cash and cash equivalents
Net debt(¹)
Net debt-to-LTM Adj. EBITDA(2)
6/30/22
$244
$269
6/30/22
$2,623
$244
$2,380
(1): Total debt includes the outstanding principal on the Company's borrowings. Total debt excludes the drawn amounts of a local $75m Credit Facility (upsized in Q2'22 from $50m Q1'22) held in the US outside the
Company's Senior Credit Facility. The nature of the facility is to draw on the facility daily and to prefund daily interchange and it acts as a source of working capital.
(2): Net debt-to-LTM Adj. EBITDA is defined as Net Debt (Total Debt less Cash and cash equivalents) divided by the Company's adjusted EBITDA as defined in the appendix for the last 12 months and does not represent the
definition of adjusted EBITDA that is used for covenant calculation purposes.
5.7x
18View entire presentation