Essity ESG Presentation Deck
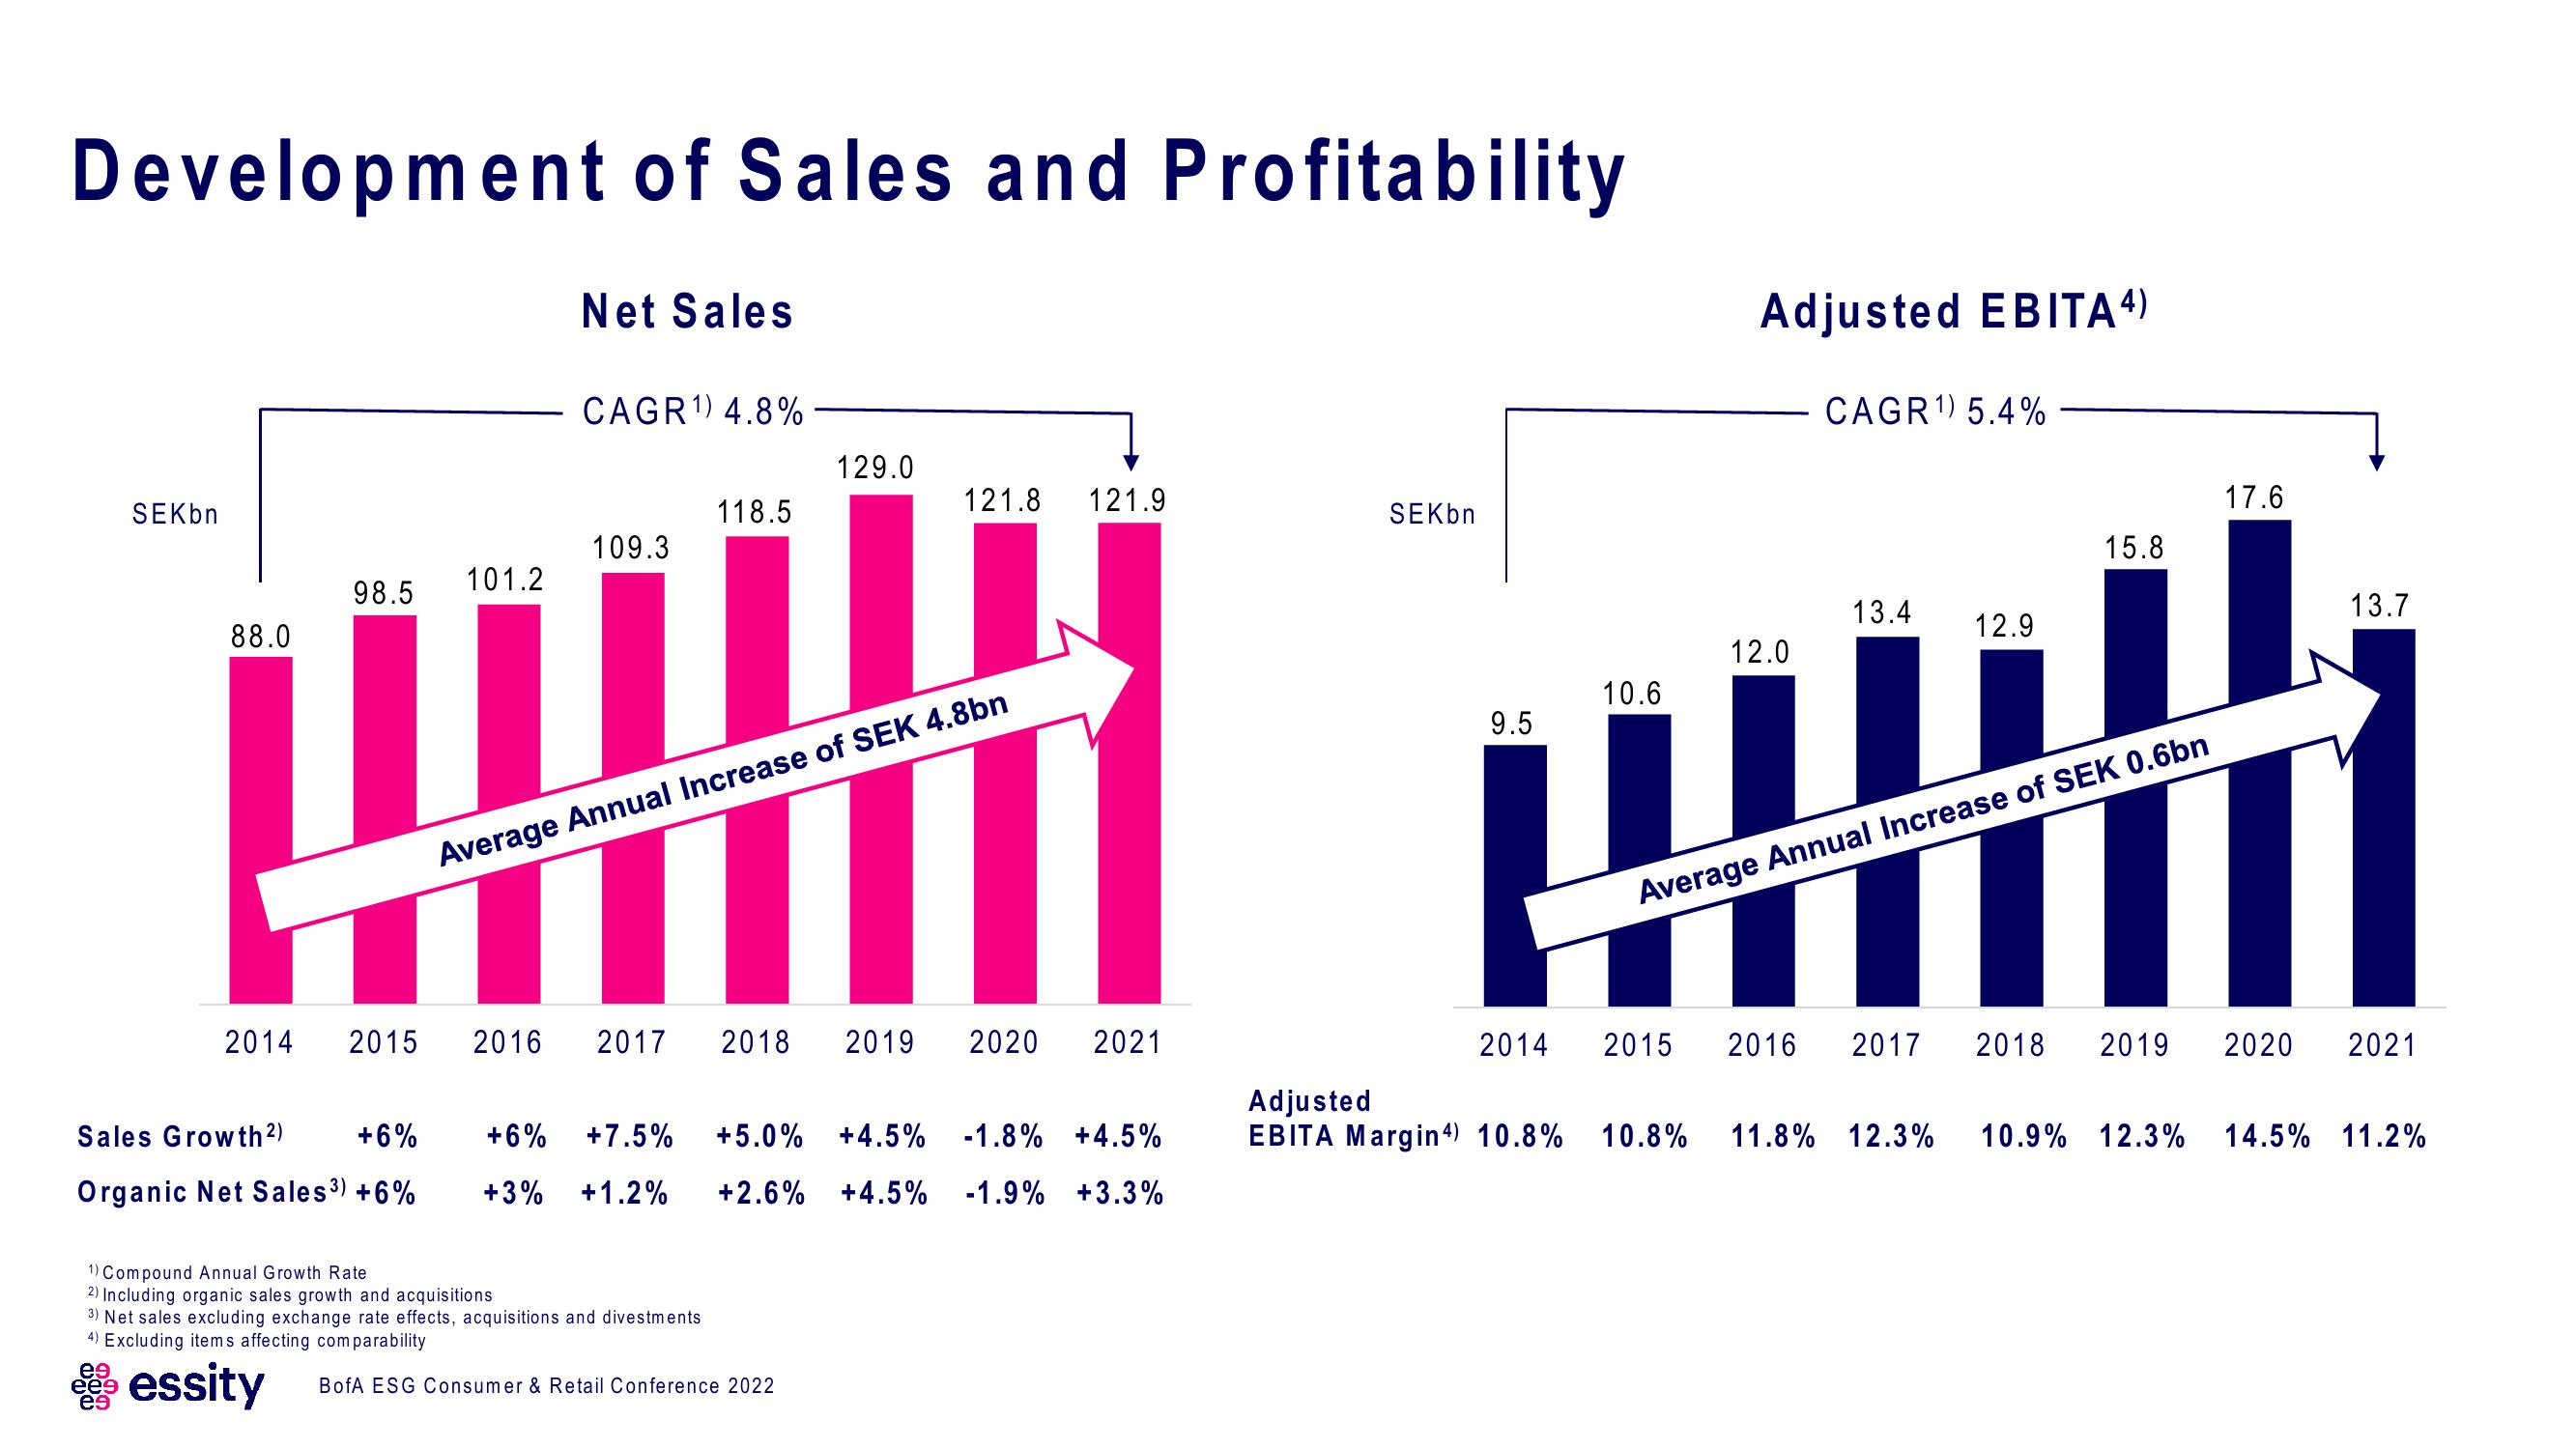
Development of Sales and Profitability
SEKbn
88.0
eeg
e9
2014
98.5
Sales Growth ²) +6%
Organic Net Sales ³) +6%
101.2
Net Sales
CAGR ¹) 4.8%
109.3
2015 2016 2017
+6% +7.5%
+3% +1.2%
1) Compound Annual Growth Rate
2) Including organic sales growth and acquisitions
3) Net sales excluding exchange rate effects, acquisitions and divestments
4) Excluding items affecting comparability
essity
118.5
Average Annual Increase of SEK 4.8bn
2018
129.0
BofA ESG Consumer & Retail Conference 2022
121.8 121.9
2019
2020
2021
+5.0% +4.5% -1.8% +4.5%
+2.6% +4.5% -1.9% +3.3%
SEKbn
9.5
2014
Adjusted
EBITA Margin4) 10.8%
10.6
Adjusted EBITA 4)
12.0
CAGR ¹) 5.4%
13.4
12.9
15.8
Average Annual Increase of SEK 0.6bn
17.6
13.7
2015 2016 2017 2018 2019 2020 2021
10.8% 11.8% 12.3% 10.9% 12.3% 14.5% 11.2%View entire presentation