Presto SPAC Presentation Deck
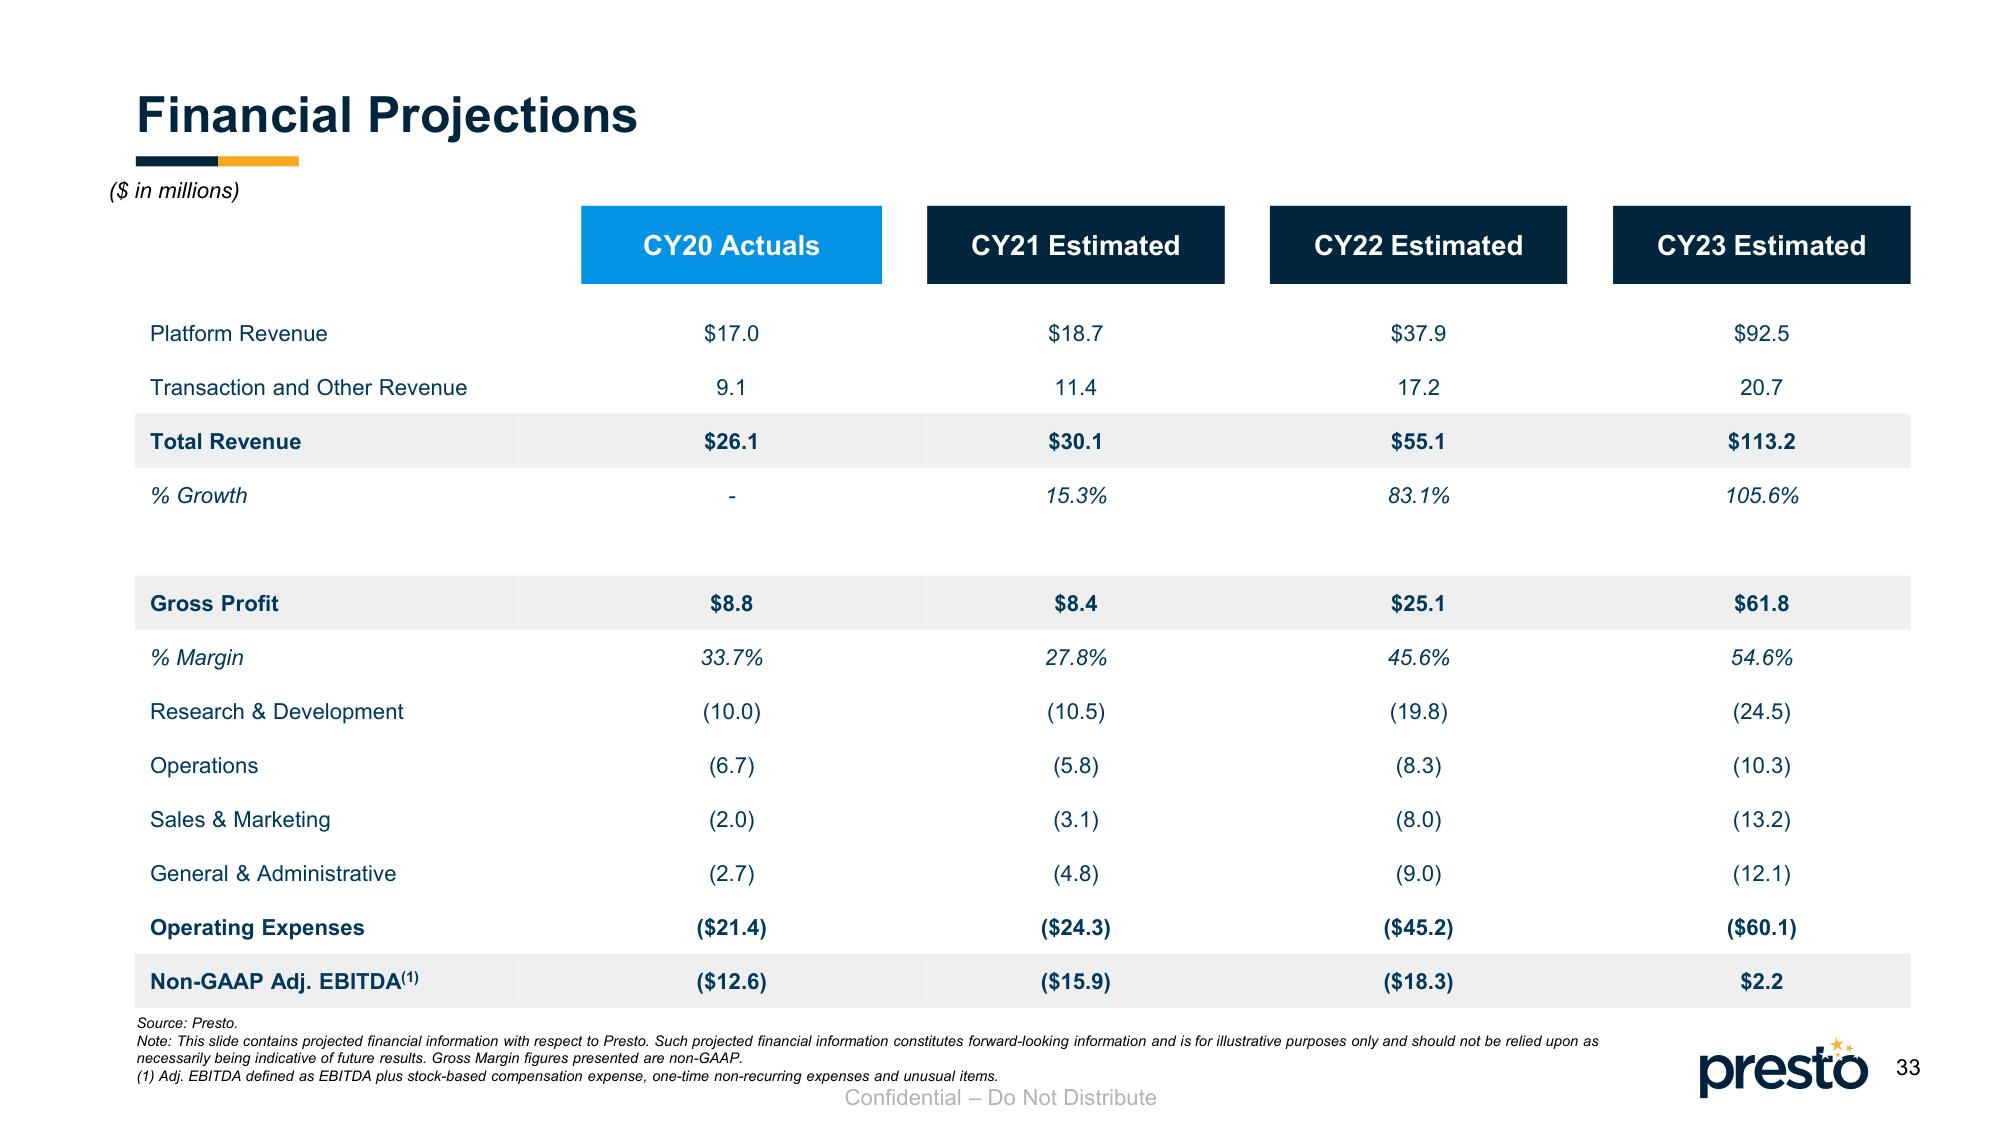
Financial Projections
($ in millions)
Platform Revenue
Transaction and Other Revenue
Total Revenue
% Growth
Gross Profit
% Margin
Research & Development
Operations
Sales & Marketing
General & Administrative
CY20 Actuals
$17.0
9.1
$26.1
$8.8
33.7%
(10.0)
(6.7)
(2.0)
(2.7)
($21.4)
($12.6)
CY21 Estimated
$18.7
11.4
$30.1
15.3%
$8.4
27.8%
(10.5)
(5.8)
(3.1)
(4.8)
($24.3)
($15.9)
CY22 Estimated
Confidential - Do Not Distribute
$37.9
17.2
$55.1
83.1%
$25.1
45.6%
(19.8)
(8.3)
(8.0)
(9.0)
($45.2)
($18.3)
Operating Expenses
Non-GAAP Adj. EBITDA(1)
Source: Presto.
Note: This slide contains projected financial information with respect to Presto. Such projected financial information constitutes forward-looking information and is for illustrative purposes only and should not be relied upon as
necessarily being indicative of future results. Gross Margin figures presented are non-GAAP.
(1) Adj. EBITDA defined as EBITDA plus stock-based compensation expense, one-time non-recurring expenses and unusual items.
CY23 Estimated
$92.5
20.7
$113.2
105.6%
$61.8
54.6%
(24.5)
(10.3)
(13.2)
(12.1)
($60.1)
$2.2
presto
33View entire presentation